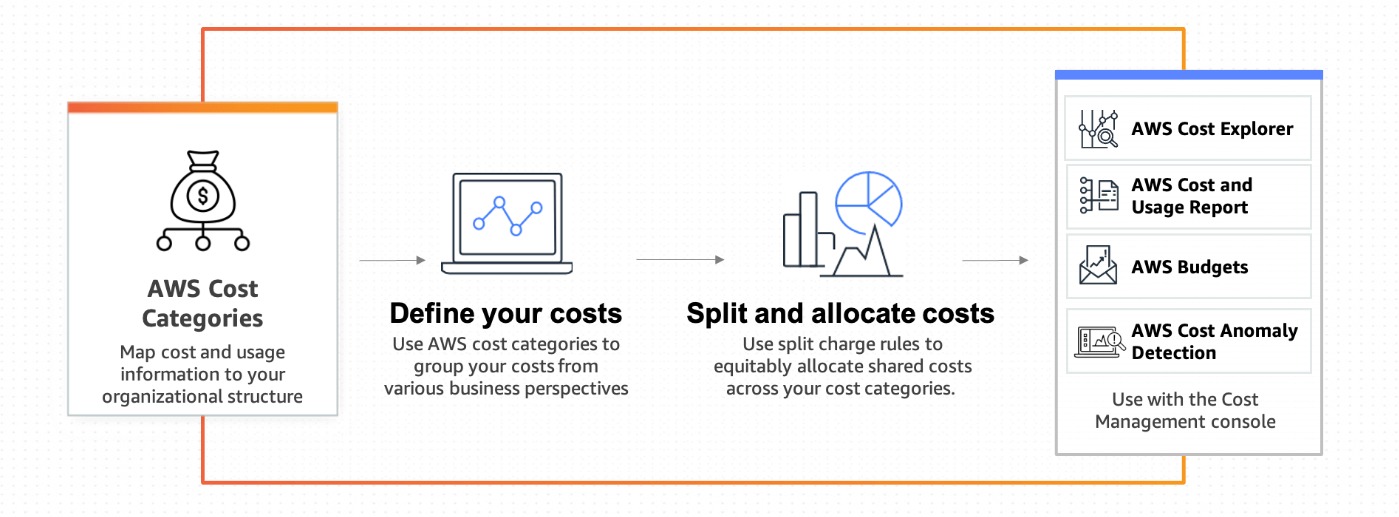
Treat cloud cost as a loop. Match usage to charges, give every large charge an owner, pick changes that suit the workload, and track both cost and service results. This works for teams whose cloud spend varies. If your billing data or ownership is unreliable, fix that before you buy tools or sign long-term commitments. Start with one recent bill and find its largest unexplained charge.
A cloud bill can climb while an application does exactly what it should. It can also stay flat while idle resources, costly network paths or badly attributed shared services eat money. Three things matter: what caused the charge, what value it supports, and who can change it.
What cloud cost management covers (and how FinOps works)
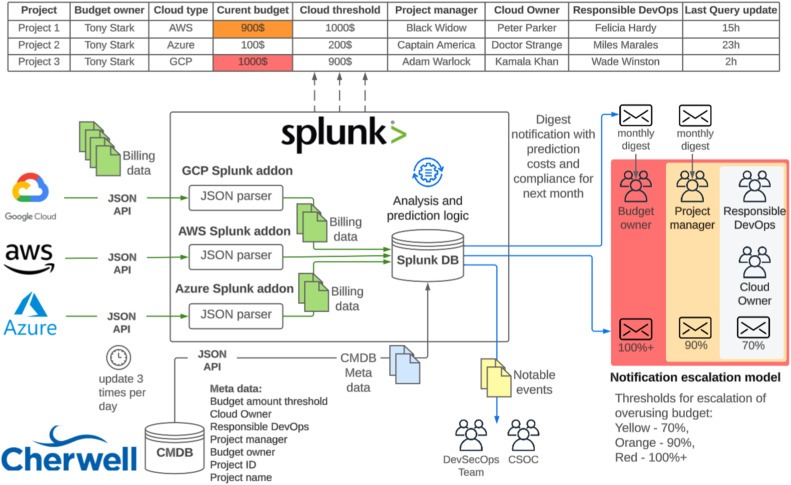
Monitoring tracks spending and usage changes. Management turns those observations into allocation, forecasting, governance and financial decisions. Optimization changes consumption, effective rates or architecture when the evidence supports it. For rightsizing, idle capacity and network charges, the cloud cost optimization change checklist lays the requirements side by side.
FinOps gives teams a shared way to run this work. The FinOps Foundation framework describes three recurring phases: Inform, Optimize and Operate. Inform makes costs visible and attributable. Optimize evaluates changes. Operate keeps accountability and review going. The phases feed each other, and the framework doesn’t prescribe one process for every organization.
Engineers know how resources behave and what constrains a service. Finance keeps reporting consistent and builds forecasts. Product and business owners decide whether the spending buys a worthwhile outcome. The wider FinOps framework also covers SaaS, AI and private infrastructure; this article deals with public-cloud workloads.
A monthly total can’t tell you whether demand grew, a resource is wasteful or discount treatment changed. Before you investigate, pin down the account or project, the reporting period, the workload or product, and the business owner.
Where unexpected cloud charges come from
Cloud charges follow several meters. A stable virtual-machine setup says nothing about next month’s storage, data transfer, request traffic or provisioned network services.
| Charge family | Dimensions to examine | Common cause |
|---|---|---|
| Compute | Running hours, provisioned capacity, metered execution | More instances, larger resources, idle runtime |
| Storage | GB-months, operations, retrieval, retained copies | Data growth, snapshots, changed access behavior |
| Network and processing | Transferred GB, processed GB, regional paths | Outbound traffic, cross-zone routing, NAT processing |
| Standing infrastructure | Provisioned hours for gateways, load balancers, related services | Services stay available during quiet traffic periods |
| Financial adjustments | Credits, discounts, commitments, accounting treatment | Effective rates or reported totals change |
A jump in processed traffic needs a different investigation from a rise in instance-hours.
Why NAT Gateway bills surprise teams
According to AWS NAT Gateway pricing, the service charges per available hour and, separately, per GB processed. Data-transfer charges can also apply, including on some cross-Availability-Zone paths.
That split caught out an AWS Activate user whose NAT line turned out to be a huge share of spend:
We’re on AWS Activate credits and just realized NAT Gateway (hourly plus data processing charges) is eating up about 80% of our total AWS spend. Didn’t expect it to be anywhere near that high until we actually looked at Cost Explorer. We know some of the usual fixes exist, like VPC endpoints for S3/DynamoDB, consolidating NAT Gateways in non-HA environments, maybe switching to NAT instances for low-traffic dev setups, but haven’t touched any of it yet and want to understand what actually works before we start ripping things apart.
The 80% is the poster’s own figure, and the suggested fixes are untested in that account.
For a gateway, ask four things. How many available hours were billed? How many GB did it process? Would an endpoint change the route for that service? What endpoint, transfer or availability costs would the new design add?
Sort your largest unexplained line item into compute, storage, network processing, standing infrastructure or financial adjustment. That tells you which kind of change can affect it.
Read and reconcile a cloud bill before acting
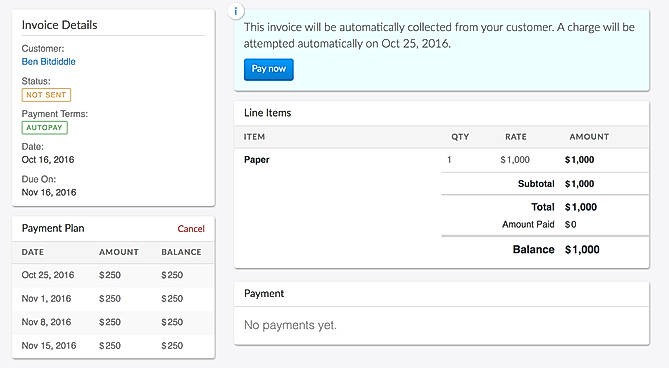
Compare like with like: same period, same service boundaries, same accounting method. A dashboard, a detailed usage export, a forecast and the final invoice can still disagree, because their data arrives at different times and carries different financial treatment.
| Reconciliation field | What to identify | Why a mismatch matters |
|---|---|---|
| Period and scope | Billing dates, accounts, projects, regions | Different boundaries produce different totals |
| Financial basis | Estimated, invoiced, net, gross, amortized where available | An accounting change can resemble usage growth |
| Usage detail | Service, resource, usage quantity and unit | Summary cost can conceal the relevant meter |
| Adjustments | Credits, discounts, refunds, applicable taxes | Financial treatment changes the number compared |
| Export coverage | Start period, granularity, resource detail, late entries | Missing or delayed data distorts a comparison |
To compare forecast against actual spending, use a matched basis: forecast variance = actual comparable cost - forecast comparable cost. A positive result means actual cost exceeded the forecast. It doesn’t tell you whether demand, pricing, allocation or an adjustment caused the gap. Record any amount you can’t reconcile yet, and label credits as financial adjustments so nobody reads them as lower resource use.
A detailed export ties the amount to service and usage dimensions. AWS Cost and Usage Report 2.0 exposes configurable billing detail. Google Cloud offers standard and detailed billing exports to BigQuery, with scope and historical coverage set by configuration. To see why totals differ between CUR 2.0, Cost Explorer and your AWS invoice, read how to reconcile AWS Cost and Usage Reports.
In AWS CUR 2.0, the table is named COST_AND_USAGE_REPORT. Its TIME_GRANULARITY option accepts HOURLY, DAILY, or MONTHLY; INCLUDE_RESOURCES adds resource-level detail where supported and may increase data volume.
Who owns cloud cost decisions?
A charge becomes actionable once you know its purpose, who controls it and who pays for it. Those are often three different people.
- Billing account owner: Controls the account or administrative boundary.
- Technical service owner: Understands dependencies, usage and what a change to the resource would break.
- Business or budget owner: Decides whether the expense supports the product’s objectives and approves major changes.
- Finance or FinOps partner: Maintains reporting methods, allocation policies, forecasts and economic measures.
Infrastructure expertise doesn’t prepare you for financial commitments and budget forecasting. One DevOps contributor described being handed those responsibilities after working on utilization:
This is my first year DevOpsing, and I kind of took it as a challenge to reduce our cloud bill, mostly as an exercise for myself. Tuning requests and limits, cleaning up idle resources, pushing for better utilization, all that. So management Good Will Hunting’d me and said, “Oh you like apples? How do you like them apples?” and gave me full FinOps responsibilities. Now this is a completely new world for me. I used to work on scaling behavior, instance types, cluster efficiency, etc. Now I’m expected to have an opinion on how much we should commit, how to model future usage, how to balance flexibility vs discounts, how to talk to finance…
Account and project boundaries, tags and metadata tie direct charges to services or teams. A shared ingress component or logging service needs a documented split rule, a shared-overhead rule or an explicit unallocated category.
Showback shows teams the costs allocated to them and is part of the practice the FinOps Foundation describes. Chargeback moves those costs through internal accounting or budgets when company policy requires it.
Build a cost-to-owner map for large expenses: technical owner, business owner, allocation rule and the role that approves significant changes. Keep unresolved shared costs visible until someone takes them on.
What cost alerts cannot prevent
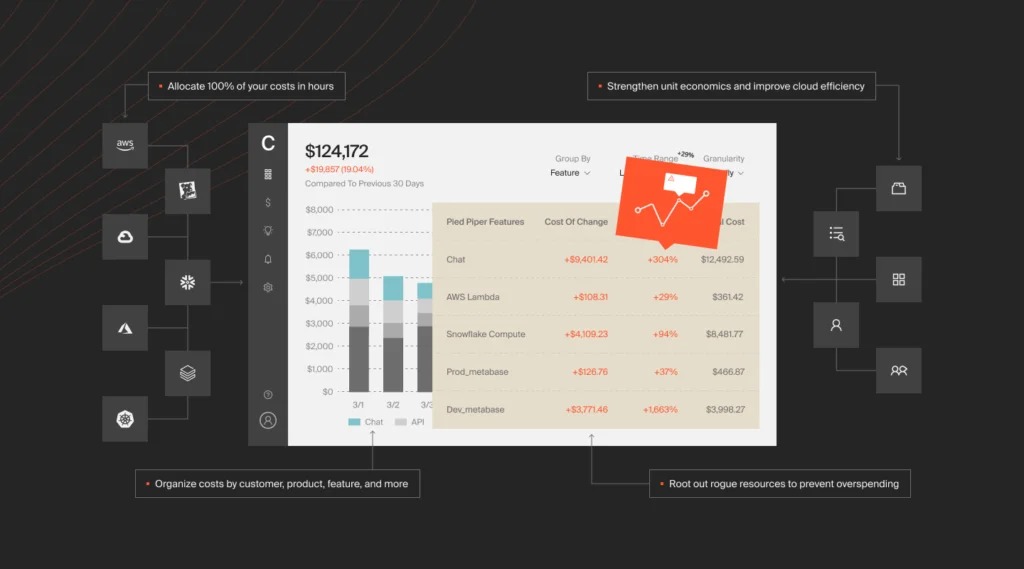
Financial alerts fire after billing data arrives. They complement engineering telemetry, access controls, quotas and incident response, which work on different signals and timescales. A forecast estimates future spending, a budget compares costs against a threshold, and anomaly detection looks for unusual patterns. An alert on its own doesn’t stop resource consumption.
AWS says Budgets uses billing data refreshed at least daily. Budget actions are configured separately and depend on permissions.
AWS Cost Anomaly Detection processes billing data and may take up to 24 hours after usage to detect an anomaly. A new monitor can take up to 24 hours to begin, and a newly introduced service may need 10 days of history. It also excludes most third-party AWS Marketplace charges, and AWS directs users to Budgets for those.
An r/aws poster described S3 transfer charges after an apparent traffic spike, then a conversation with AWS support:
About a month ago I made a post about a DDoS/unexpected traffic spike on my AWS S3 account that resulted in a $15.5k data transfer bill. I opened a support case with AWS on March 1st, and they got back to me today with a billing adjustment. They reduced it by about $10.5k, which I do appreciate, but the remaining balance is still way more than I can afford. I was honestly hoping it would come down to something small that I could realistically pay (like $100–$200), but even after the adjustment, I just don’t have the money to cover what’s left.
The incident is unverified, the title and body describe the adjustment differently, and nothing here promises a refund to anyone else.

A billing alert reaches the people who own the budget. Stopping abnormal usage takes technical controls suited to the workload.
Test a budget or anomaly notification for recipients, permissions and data freshness. Separately, write down who can intervene during a traffic or billing incident, which preventive controls exist and how an unexpected charge gets escalated. For anomaly monitors, spend alerts and Cost Explorer, see how to investigate AWS cost anomalies and alerts.
Which optimization lever fits the workload?
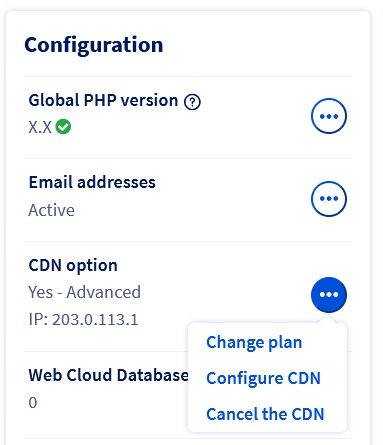
Match the intervention to the cost driver and to the requirements it must keep. Reducing usage, lowering an eligible rate and changing architecture solve different problems. Usage optimization changes the capacity or duration you consume. Rate optimization lowers the price of qualifying usage, often through a commitment. Architecture optimization changes how the service is delivered, including its network path and storage design.
| Workload evidence | Candidate intervention | Cost affected | Important constraint |
|---|---|---|---|
| No remaining verified dependency | Remove, schedule, or reconfigure the resource | Runtime or provisioned capacity | Recovery, backups, retention |
| Sustained excess capacity | Evaluate rightsizing or scaling | Compute quantity | Peak demand, latency, service objectives |
| Stable, predictable eligible demand | Evaluate Savings Plans or Reserved Instances | Effective rate | Duration, flexibility, unused commitment |
| High NAT or transfer charges | Compare routing and endpoints | Processed GB, provisioned hours, transferred GB | Endpoint cost, zone placement, resilience |
| Spending rises with productive demand | Evaluate per-unit efficiency before cutting capacity | Cost per business output | Customer experience, transaction success |
| Charge has no accountable owner | Improve allocation and responsibility | Decision process and visibility | Quality of billing and tagging evidence |
When a cheaper network path costs more to operate
Take a private workload that reaches an AWS service through NAT Gateway. A service-specific VPC endpoint can change the route, but you need to weigh endpoint fees, any changed data transfer, Availability Zone placement and resilience against the NAT charges.
Switching to a NAT instance adds patching, capacity, security and failure-management work. A small workload weighing public cloud against a simpler VPS faces the same trade-off between flexibility and maintenance.
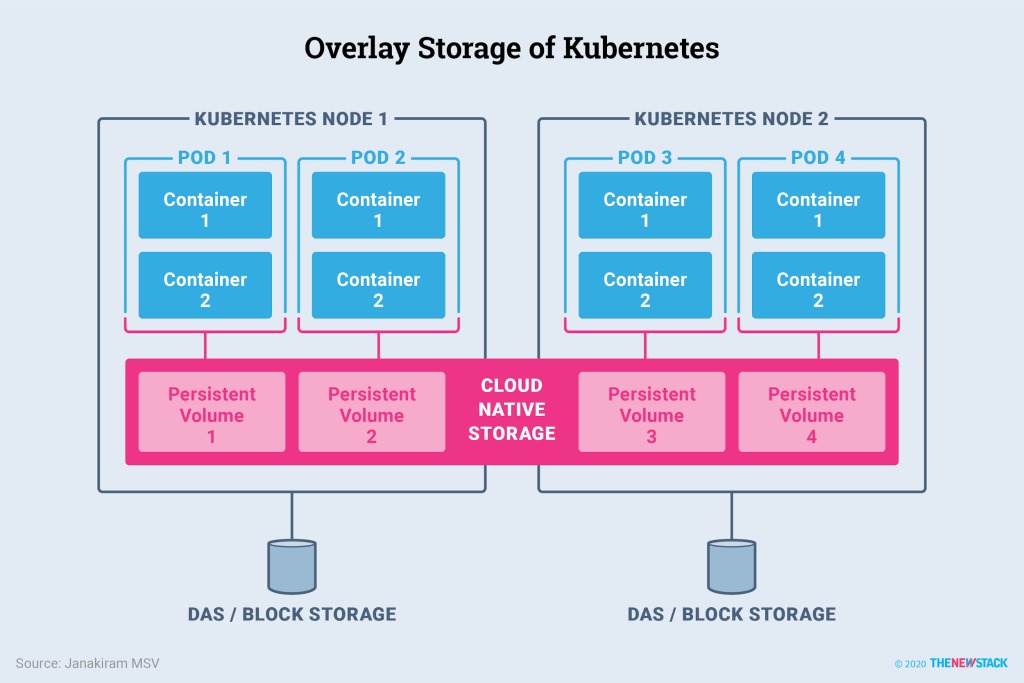
Leaving the architecture alone can be the right call. Higher spend from serving more customers successfully can mean better business results.
For any proposal, name the meter it should move, the baseline, a service-quality or recovery guardrail and a rollback condition. Test on a limited scope before you expand.
Cloud cost versus business value
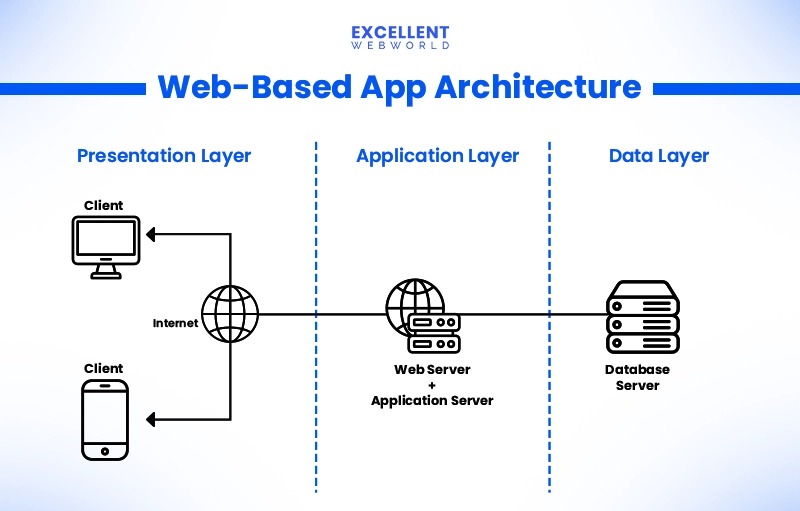
A cloud invoice records an amount of money. Unit economics ties a defined share of that cost to a measurable output of the product.
A growing application can spend more overall and still cost less per completed transaction. A smaller bill can also signal weaker value, if successful customer operations fall faster than spending.
The FinOps Foundation’s Unit Economics guidance describes how technology costs relate to business measures. A metric only works when its cost boundary matches the output you measure.
For a chosen metric, unit cost = comparable attributed and appropriately allocated cloud cost / verified business output.
The numerator can include shared costs under a documented policy. The denominator can be completed transactions, requests, jobs or another valid unit for the product. A zero denominator leaves the ratio undefined.
When stored data outlives its business purpose
Data kept after a customer cancels keeps generating storage charges. A contributor to a FinOps discussion traced such a cost at a former employer:
I remember working at one SaaS company where we had huge storage bills. I took the time, soon after I was hired, to look at why they were so high. Turns out, we were storing data that came from customers who had canceled their service a decade prior. And when you added up the costs associated with maintaining that data, it had cost us over the past 10 years more than the revenue that the customer had paid. The analysis took me forever. But when I showed we were spending 6 figures per year on this waste, the rest of the executive team was thrilled to spend money on such a “boring” project.
The six-figure amount is the contributor’s own account. Deletion also depends on contractual retention, legal holds, recovery needs and product obligations.
Define one business-unit metric with a fixed period and allocation method. After a change, compare it next to a quality measure such as successful transactions or availability. That separates real efficiency gains from savings caused by fewer customers or weaker service. If resource tags, AWS accounts or billing allocations change the decision, run through the AWS cost allocation tag audit checklist.
When to use native cloud-cost tools or a FinOps platform
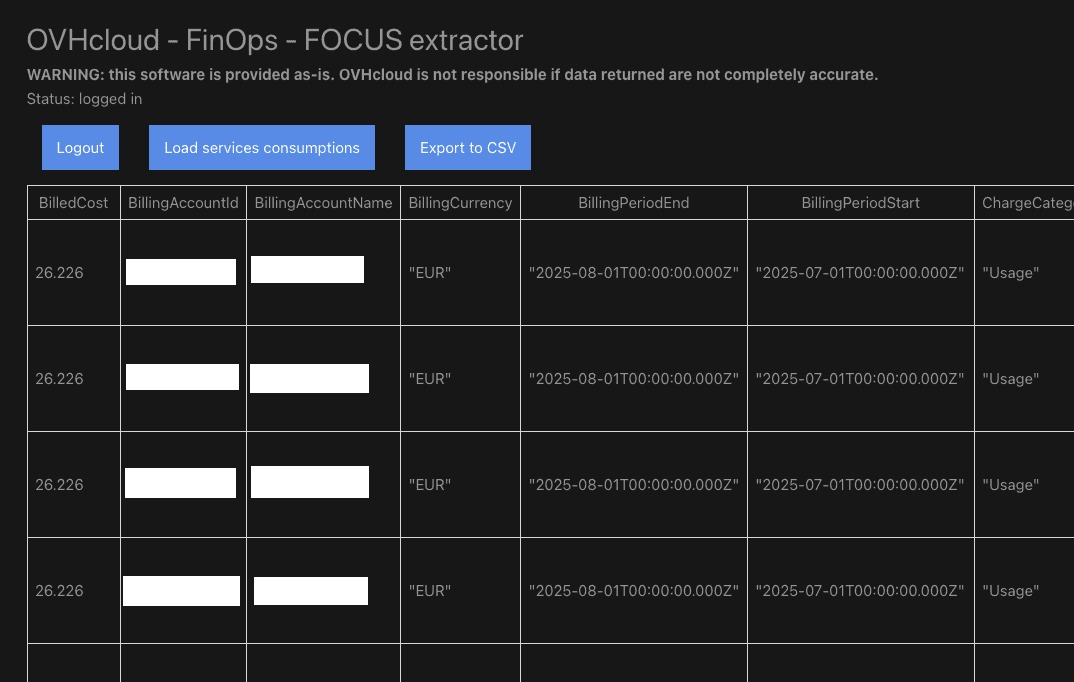
Native billing consoles and exports are enough when your team can reconcile charges, name owners and act on the results. Consider a specialist platform when a specific need stays unmet, such as cross-provider allocation, consolidated reporting or coordinated anomaly response.
Google Cloud documents its FOCUS-normalized billing export with a Preview designation, so check its coverage and maturity if your evaluation depends on that format. Before you buy, record the missing capability, the acceptance test, integration needs, who will operate the tool and the total licensing and maintenance cost.
How to operate FinOps as a repeatable cycle
FinOps becomes routine when each change stays linked to the reason behind it and the result that followed. A short operating record covers:
- Charge and scope: The workload, reporting period and expense under review.
- Evidence: The reconciled billing basis and the identified cost driver.
- Accountability: Technical and business owners, plus the approver.
- Decision: The proposed change and its trade-offs, or the reason to keep the current design.
- Outcome: Spending on the same basis, a business measure where relevant, and operational guardrails.
- Review trigger: A forecast variance, a major workload change or a planning checkpoint.
Following one charge through to a decision
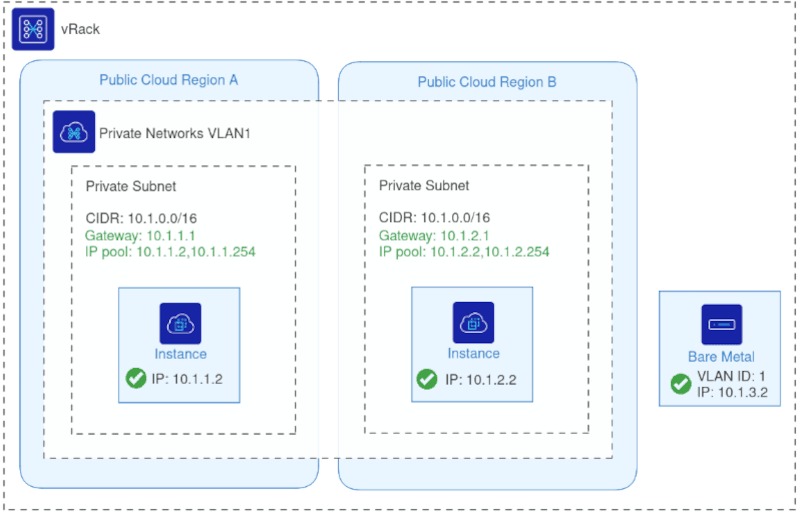
Imagine a team sees a larger NAT Gateway line item. In the reconciled report, processed GB have risen while gateway-hours stayed flat, which points to traffic and routes. The platform engineer can explain the network topology, the budget owner can approve an endpoint evaluation, and the team can reject any design that fails its availability requirements.
Adopt the endpoint change only if total network costs improve on the same basis and availability holds. Otherwise, keep the existing route. After a controlled change, compare processed GB and total network charges on the same billing basis, with latency and service errors as guardrails.
Make cost responsibility part of architecture decisions
Network routing, data retention, recovery requirements and capacity choices set spending before production traffic starts. A design review with engineering and finance in the room can weigh those costs while the plan can still change.
Set the review cadence by how volatile spending is and how much business risk it carries. A forecast variance, a major architecture change or a sharp charge increase calls for an earlier review. Rising spend is fine when it supports demand and service quality at sound unit economics.
To size your own bill, work through the cloud cost estimation worksheet for compute hours, storage usage and network egress.