
Use CUR 2.0 when a Cost Explorer view cannot answer a specific billing or allocation question, and verify the export, cost basis, charge types, and reporting period before trusting the total. If you only need a quick spending overview, Cost Explorer is the simpler choice. Next, identify the charge you need to explain and determine whether line-item detail is necessary.
When to Use AWS Cost and Usage Reports Instead of Cost Explorer
Cost Explorer works well for spending trends and grouped service charges. CUR 2.0 gives you the rows for custom, repeatable billing analysis. A monthly trend needs no export. Explaining credits, charge types, account ownership or a disputed total does. Define your question as a service, account, charge and billing period before you pick a tool. The checks for anomaly monitors, spend alerts, and Cost Explorer are explained in how to investigate AWS cost anomalies and alerts.
Create a CUR 2.0 Export With the Right Columns and Granularity
AWS Data Exports is where a new CUR 2.0 workflow starts. It uses a consistent schema, while legacy CUR reports have variable field layouts and downstream dependencies. Plan the migration of existing legacy queries and dashboards before you switch their source.
Pick the least detailed setup that answers your question. More rows and columns mean more S3 storage and more query work downstream.
| Setting | Choice | When it helps |
|---|---|---|
TIME_GRANULARITY | MONTHLY | A monthly charge comparison is enough. |
TIME_GRANULARITY | DAILY | You need day-by-day changes. |
TIME_GRANULARITY | HOURLY | You need to examine usage hour by hour. |
INCLUDE_RESOURCES | Enable if you need it | You need individual resource detail. Some charge records still have no resource ID. |
INCLUDE_SPLIT_COST_ALLOCATION_DATA | Optional | You need split-cost allocation data. |
INCLUDE_IAM_PRINCIPAL_DATA | Optional | You need Amazon Bedrock IAM-principal detail, available for eligible data beginning April 8, 2026. |
For field definitions and permitted export options, see the AWS CUR 2.0 table dictionary.
Configure the export in AWS
- Open the export workflow: In Billing and Cost Management, go to Data Exports and select Create export.
- Name the dataset: Choose a standard data export with the
COST_AND_USAGE_REPORTtable for CUR 2.0, and give it a meaningful name. - Select the detail you need: Choose columns, time granularity and optional data. Add a native analytical integration if you need one. Athena integration selects Parquet with overwrite delivery. Redshift integration selects gzip/CSV.
- Set delivery: Specify the Amazon S3 destination and delivery preferences, then create the export.
The restricted QueryStatement in Data Exports defines which fields the export contains. TableConfigurations controls options such as granularity and resource detail. You run Athena SQL later, against the delivered and cataloged data. A query written for one environment will not necessarily work in the other.
You can edit an existing CUR 2.0 export to change supported columns, table configurations, time granularity, compression and format. Changes take effect with the next scheduled delivery. You cannot change the export name or Billing view, and some delivery-mode transitions are restricted. AWS documents these limits in its export editing instructions.
On June 2, 2026, AWS announced native Athena and Redshift integrations for CUR 2.0, including associated export formats and integration resources. The announcement covers commercial AWS Regions except AWS GovCloud (US) and China Regions.
When principal-level detail helps
Amazon Bedrock IAM-principal attribution ties eligible usage to a calling identity. A shared service role may serve several applications, so the principal does not always tell you the workload.
One practitioner asked how much extra data this feature generates:
I have been reading the docs and the marketing copy makes it sound like a free upgrade. The fine print is less clean. Three things I want to validate with anyone who has actually turned this on: 1. CUR file size. The docs say enabling principal data splits each cost line into one row per contributing principal. If you have a single Bedrock service account serving ten internal teams, the line for that month becomes ten rows instead of one. For folks landing CUR in Athena or Redshift, what is the real query-cost delta you saw post-enablement? Did you have to revisit partitioning?
The poster asks about query cost and row growth but reports no measured increase. Turn principal detail on only if the extra rows give you a better attribution.
Verify the Export’s S3 Files, Manifest, and Permissions
The export definition sets where the report goes. The delivered objects and Manifest.json show which files and billing period are available for analysis.
A destination uses the export’s bucket, chosen prefix and name:
s3://<bucket>/<prefix>/<export-name>/
    data/BILLING_PERIOD=YYYY-MM/
    metadata/BILLING_PERIOD=YYYY-MM/
Data arrives as CSV/GZIP or Parquet. The manifest lists the report period, delivered files, columns and integration resources.
Inspect the S3 prefix and compare the latest manifest’s file list with the billing month you want. CUR 2.0 refreshes at least daily, so an old copy may differ from the latest delivery. Previous-period data may be revised during the first two weeks after month-end.

With create-new delivery, each refresh execution is retained separately. With overwrite, refreshed objects replace the files for that billing period. The choice decides how many historical delivery versions you keep and how much storage they use.
Access has three layers
Creating or editing the export requires billing and Data Exports permissions. The operations draw on bcm-data-exports actions and supplementary cur permissions.
Reading the delivered objects depends on S3 policies, and sometimes on encryption or organization controls. Querying through Athena or a generated integration adds catalog and analytics-service permissions.
A management-account export can include organization-level data. A member-account export has a narrower scope. If you expect all linked accounts but hold a member-scoped report, the total looks incomplete even though delivery succeeded.
Query CUR 2.0 in Athena Without Mixing Report Schemas
Athena reads the exported files through a catalog table. Check the real table name and columns before you write a query. COST_AND_USAGE_REPORT is a virtual source in Data Exports, and the Athena table may have a different name.
An export with Athena integration delivers a crawler-cfn.yml CloudFormation template and an export-specific create-table SQL file. Deploy the template to set up the integration resources, or run the SQL to create the table manually and register its partitions as documented. If an Athena table already exists, confirm its database, table location and partitions before you use the query below.
CUR 2.0 uses names such as bill_billing_period_start_date, line_item_usage_account_id, line_item_product_code, line_item_line_item_type and line_item_unblended_cost. The legacy CSV concepts lineItem/LineItemType and lineItem/UnblendedCost are stored as different physical fields. Tags may also require navigating CUR 2.0’s nested structures.
Group One Billing Month by Account, Service, and Charge Type
This Athena example groups one billing month by usage account, AWS product code and charge type. Replace the database, table and the illustrative July 2026 month with values from your own export.
SELECT
    line_item_usage_account_id AS usage_account,
    line_item_product_code AS service_code,
    line_item_line_item_type AS charge_type,
    COUNT(*) AS line_count,
    SUM(line_item_unblended_cost) AS unblended_subtotal
FROM example_database.example_cur2_table
WHERE CAST(bill_billing_period_start_date AS DATE) = DATE '2026-07-01'
GROUP BY 1, 2, 3
ORDER BY unblended_subtotal DESC;
The result shows service codes and charge types for one month. It is not an invoice total yet. The query sums one cost field across all included line types and does not select invoice charges.
The line_count column shows how many rows fed each subtotal. Add line_item_resource_id when it is present for a charge and the export included resource-level detail.
Understand CUR Charges Before Adding Up the Cost Columns
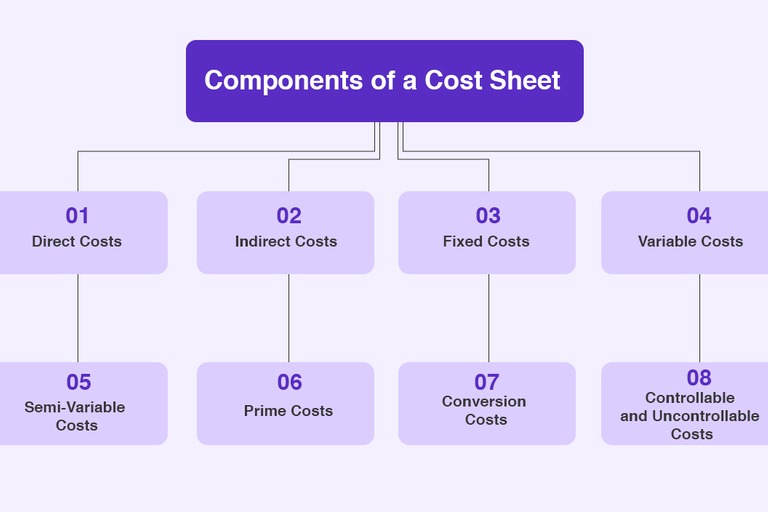
CUR contains usage records alongside fees, discounts, credits, refunds, taxes and commitment entries. State which cost basis and charge types your subtotal includes, so others can reproduce it.
line_item_unblended_cost is an unblended cost measure for line items that carry it. The amount payable after commitment accounting and financial adjustments needs additional categories and different treatment.
| Charge category | Line-item types | What it covers |
|---|---|---|
| Consumption | Usage, DiscountedUsage | Metered consumption and discounted-usage records. |
| Credits and adjustments | Credit, Discount, Refund | Signed adjustments change the net financial result. |
| Fees and tax | Fee, RIFee, Tax | Charges can exist without a usage quantity. |
| Commitment fees | SavingsPlanUpfrontFee, SavingsPlanRecurringFee | Purchases and recurring charges belong to their own accounting view. |
| Covered usage and offsets | SavingsPlanCoveredUsage, SavingsPlanNegation | Treat related entries by type to avoid double counting. |
The same records can look different when a report uses cash or amortized accounting.
Define the sum you intend to produce
Write down a named metric, currency, period, payer or usage-account scope, service selection and an explicit list of included charge types. Record how you treat credits, refunds, taxes and commitment fees, then sum only the rows that belong to that definition.
For gross service use, examine usage charges before credit offsets. An invoice question needs the cash-basis financial entries. An amortized analysis spreads qualifying commitment charges across the term. Label these figures differently in a report.
A Savings Plan produces covered-usage entries and matching negations. Adding both as positive consumption overstates activity. Your accounting basis decides how each entry counts toward the subtotal.
Why CUR Totals Differ From Cost Explorer and Your AWS Invoice
Cost views differ in accounting basis, service groupings, refresh state and included adjustments. Fix the period and account scope, then identify each difference that changes the result.
Credits cause confusion when the payment after credits is far below the cost of the services consumed. One AWS user described that experience:
I’m currently in the trial phase of testing different server providers for my project. AWS’s services are great but the billing system is honestly overwhelming. I can’t figure out how much each individual service actually costs me per month. All I see is my free credits slowly going down, but when I try to check what exactly consumed them, every detailed report just shows a bunch of zeroes. This makes me really hesitant to commit to AWS. Compared to DigitalOcean, where the pricing and usage breakdowns are super clear, AWS feels like a black box.
To isolate credits in Cost Explorer, open the Charge Type filter, select Credit, and choose Exclude only. Compare the same service and billing period with and without that filter. The credit-inclusive view still shows the financial amount after adjustments. The checks for cloud billing, cost allocation, and engineering owners are explained in the FinOps cloud-cost operating cycle.
The AWS Billing and Cost Explorer comparison also documents differences in cash versus amortized presentation, service groupings, timing and rounding.
A reconciliation with named, signed categories
To find the amount charged for one period, define U as the usage subtotal, F as cash-basis fees and commitment charges, A as the signed total of credits, discounts, refunds and other adjustments, and T as taxes. The reconstruction is R = U + F + A + T, and the remaining difference is invoice amount - R.
These are symbolic buckets, not an AWS-prescribed universal invoice formula. Count each line item once, with the correct sign and coverage treatment.
| Worksheet field | CUR side | Invoice or Cost Explorer side |
|---|---|---|
| Period | Selected billing month | Same month on the invoice or Cost Explorer |
| Account scope | Management or selected usage accounts | Matching payer or member selection |
| Report state | Manifest and export refresh | Billing state available in the comparison view |
| Cost basis | Named CUR metric and charge filters | Cash, unblended or amortized view |
| Charges | U and F | Consumed usage and cash fees |
| Adjustments | Signed A plus T | Credits, discounts, refunds and tax treatment |
| Grouping | Product codes and selected dimensions | Mapped invoice or Cost Explorer service categories |
| Residual | R = U + F + A + T | Observed amount minus R, with the reason recorded |
Align the first four fields before you explain any numerical difference. If adjustments and service-grouping changes do not account for the rest, mark the residual as unresolved.
A one-year all-upfront Savings Plan shows the issue. Billing records the purchase on a cash basis, while an amortized Cost Explorer view spreads its qualifying cost across twelve months. Service categories differ too: Cost Explorer may show EC2 instance use separately from EC2-Other, while billing groups them differently.
The final invoice is the authority for the amount owed. CUR gives you the detailed records to investigate it.
Use Accounts and Cost Allocation Tags and Keep Shared Costs Visible
Account identifiers, resource IDs and activated cost allocation tags are your ownership evidence. An allocation holds up when these fields identify the consumer, or when a documented method distributes shared charges. For resource tags, AWS accounts, and billing allocations, use the AWS cost allocation tag audit checklist to compare the requirements. A management-account export covers the linked AWS Organizations accounts.
Historical tag activation has limits
Cost allocation tags must be activated to appear in cost reports. Eligible management-account requests can backfill activation for up to twelve months when the tag values already existed on the resources. Backfill changes reporting availability only. It cannot recreate a tag that was never present.
AWS allows one active backfill request at a time, no more often than once every 24 hours. The data appears after the next refresh, as described in the AWS cost allocation tag backfill guide.
Classify the costs you can explain
- Attributed: Account, resource or cost allocation data identifies the owner.
- Shared: A database, Redis cluster or other service supports several consumers, and an explicit rule distributes its charge.
- Unallocated: The records do not justify assigning an owner or share.
A shared Redis cluster may carry one team’s resource tag while serving several applications. The tag names an administrator or platform owner and does not measure each application’s consumption. Keep shared and unallocated amounts visible until you have a defensible allocation rule.
Troubleshoot Missing CUR Data, Incorrect Periods, and Query Failures
When a report looks empty or misleading, find the first layer that fails and run the check for that layer.
| Observed symptom | Layer | Targeted check |
|---|---|---|
| Export creation fails | Billing or Data Exports access | bcm-data-exports, cur and account-policy permissions |
| Expected period has no files | S3 delivery | Destination, latest manifest and billing-period directory |
| S3 has data but Athena returns no rows | Catalog or partition | Table location, catalog metadata and selected period |
| Query says a column is unknown | Schema selection | CUR generation and fields in the delivered export |
| Resource IDs or tags are blank | Eligibility and export options | Selected detail, tag activation and historical values |
| Athena works but dashboard fails | Datasource integration | Dashboard connection and query permissions |
| Charge total does not agree | Accounting interpretation | Cost basis, account scope and adjustments |
An empty Athena result after a successful S3 delivery points to table location, catalog metadata, partitions or query filters. A dashboard that fails while the same query works in Athena has its own datasource and authorization layer.
Choose the row that matches the first failure you see. A blank resource field can be a normal absence in the billing record, while a missing column usually reflects the export configuration or schema choice.