
Split the bill into NAT Gateway-hours, processed data and transfer charges. Then trace the workload behind the traffic before you change its egress path. A correctly routed gateway endpoint cuts NAT processing charges for eligible same-Region S3 or DynamoDB traffic. If a third party needs a fixed outbound IPv4 address, keep managed NAT unless an alternative meets the same networking and availability requirements for less total cost. Check the result against refreshed billing and application connectivity.
What makes up your AWS NAT Gateway bill?
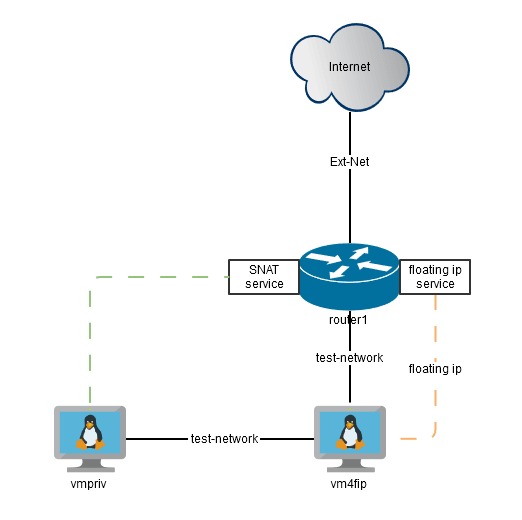
Your NAT Gateway bill grows for one of three reasons: the gateway stays provisioned, traffic passes through it, or that traffic triggers transfer charges. Each follows its own billing rules, so split them first.
| Charge | What produces it | What a high charge suggests |
|---|---|---|
| Gateway-hours | Time the gateway is provisioned and available; Regional NAT bills by configured AZ-hour | Too much provisioned capacity, unnecessary gateways or intentionally idle resources |
| Data processing | Gigabytes processed through NAT | Heavy outbound workloads, repeated downloads or traffic that could use another eligible route |
| Data transfer | Internet, cross-AZ or other network transfer | A costly traffic path whose charges change if the architecture changes |
AWS bills partial gateway-hours as full hours. That hits gateways you create and remove during short experiments, and gateways that stay available while handling almost no traffic.
Zonal and Regional NAT calculate hours differently. AWS announced Regional NAT Gateway on November 19, 2025. It manages availability across the Availability Zones you configure and bills by that AZ footprint.
A single Regional NAT resource configured across three Availability Zones produces three configured AZ-hours for every hour it runs. Counting resources tells you nothing about the hourly cost.
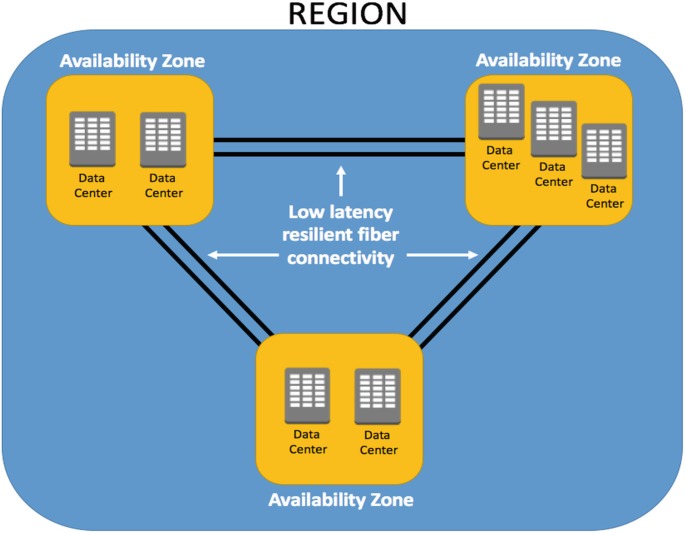
The AWS VPC pricing documentation gives a US East (Ohio) example with a gateway-hour rate of $0.045 and data processing at $0.045 per GB. Take its three-AZ illustration:
- Gateway availability: Three configured AZ-hours at $0.045 come to $0.135.
- Data processing: One processed GB adds $0.045.
- Internet transfer: One GB at the example’s $0.09 rate adds $0.09.
That totals $0.27 for the hour. These are Ohio example rates with specific traffic assumptions. Other Regions and traffic paths have their own prices.
An EC2 instance in the same AZ that reaches same-Region S3 through NAT shows why the categories matter. In AWS’s documented scenario, NAT charges for processing the traffic, and that same-Region S3 transfer adds no data-transfer charge.
A high NAT share tells you to investigate, but it doesn’t say which component is expensive. One Reddit contributor found the problem in Cost Explorer:
We’re on AWS Activate credits and just realized NAT Gateway (hourly plus data processing charges) is eating up about 80% of our total AWS spend. Didn’t expect it to be anywhere near that high until we actually looked at Cost Explorer. We know some of the usual fixes exist, like VPC endpoints for S3/DynamoDB, consolidating NAT Gateways in non-HA environments, maybe switching to NAT instances for low-traffic dev setups, but haven’t touched any of it yet and want to understand what actually works before we start ripping things apart.
In AWS Cost Explorer, select the account, Region and period of the spike. Then inspect the Usage Type Groups EC2: NAT Gateway - Running Hours and EC2: NAT Gateway - Data Processed. NAT-related ancillary costs sit under EC2 - Other, while data transfer appears under the associated service or another billing grouping. Keep those transfer entries separate from NAT-processed bytes.
For detailed charge allocation, use the AWS Cost and Usage Report, which covers CUR 2.0, Cost Explorer and AWS invoices.
Which gateway, routes and AZs are responsible?
Map each NAT Gateway ID to its mode (Zonal or Regional), configured Availability Zones, source-subnet route tables, observed traffic and responsible owner. Regional NAT manages AZ coverage without a customer-selected public subnet.
Consolidating Zonal gateways across AZs cuts gateway-hour spending but adds cross-AZ transfer or failure exposure. A standby gateway accrues hourly charges even with little traffic, so record its disaster-recovery purpose before you remove it.
Watch the check names in AWS Trusted Advisor. Its zero-bytes-over-30-days check is called Inactive NAT Gateways. The separately named Idle NAT gateways check uses Cost Optimization Hub recommendations. Neither name alone authorizes deletion.
How do you trace NAT traffic back to workloads and destinations?
Cost Explorer shows what you spent. CloudWatch and VPC Flow Logs show the traffic behind it. You need both the volume passing through NAT and the source-to-destination path that produced it.
CloudWatch exposes NAT Gateway metrics such as BytesInFromSource, BytesOutToDestination, BytesInFromDestination and BytesOutToSource. Together they show the traffic entering and leaving the gateway in each direction.
ActiveConnectionCount and the connection and packet-error metrics give operating context. Summing the byte counters does not reproduce the billed processed-GB figure. For Zonal NAT, CloudWatch identifies the metrics by NatGatewayId. For Regional NAT, use NatGatewayId and AvailabilityZone together to read the AZ-specific metric series.
VPC Flow Logs show network relationships more closely. In the documented AWS examples, Regional and Zonal NAT Gateways use different record-identification patterns.
Zonal and Regional flow-log identifiers
For a Zonal NAT Gateway, AWS examples identify the gateway by its elastic network interface through interface-id. Start there to correlate NAT traffic with the gateway and the originating workload.
Regional NAT Gateway flow-log examples use the gateway’s resource-id, such as nat-.... On regional gateway records, interface-id, instance-id and subnet-id can show as -. A query that filters on a gateway ENI misses Regional NAT records.
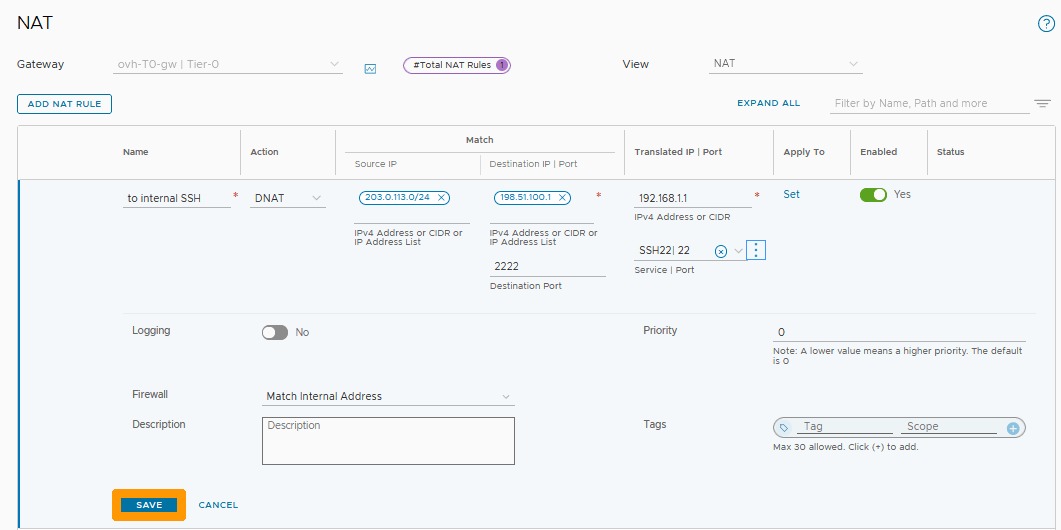
The AWS VPC Flow Logs examples show these differences, including a sample flow between private address 10.0.1.5 and destination 203.0.113.5.
For source attribution, compare srcaddr and dstaddr with pkt-srcaddr and pkt-dstaddr where the record format supplies those fields. NAT translation changes the addresses visible along the path, so the original packet endpoints point you to the workload and destination.
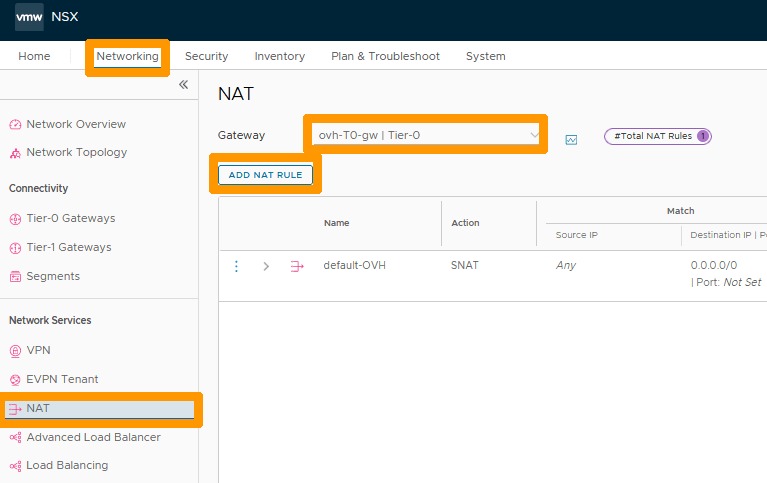
To find the highest-volume flows, pick the log group that delivers Flow Logs for the affected gateway and limit the time range to the spike. If the group holds records from several resources, add a Logs Insights filter on the Regional NAT resource-id or Zonal NAT interface-id, using the parsed field name and the gateway identifier from your inventory. Restrict the traffic direction with source, destination or packet-address fields before aggregating. Once those filters select the intended flows and srcAddr, dstAddr and bytes are available, rank the address pairs with:
fields srcAddr, dstAddr, bytes
| stats sum(bytes) as observedBytes by srcAddr, dstAddr
| sort observedBytes desc
| limit 20
The query aggregates only the records the log group and your filters include. A custom log format may need field parsing first. Map the address pairs to workload ENIs. When translation hides the original endpoints, compare pkt-srcaddr and pkt-dstaddr in the applicable format. The result lists observed traffic candidates.
Work through it in three steps:
- Align the observation period. Match NAT CloudWatch activity to the period when billed usage rose, allowing for differences in metric granularity and billing updates.
- Match the gateway to its workload. Use the Regional resource identifier or Zonal interface identifier, then relate source ENIs and subnet routes to the originating service.
- Classify the destinations. Sort traffic into same-Region AWS services, container-image retrieval, third-party APIs and internet downloads before you pick a remedy.
A private-subnet microservice making repeated outbound calls needs a different fix than frequent S3 access. The first needs a public internet path. The second can qualify for a gateway endpoint.
Record each finding as workload, destination, observed traffic volume and time window. Flow records that report SKIPDATA or NODATA mark missing observations. Log collection and queries add charges of their own.
When do VPC endpoints reduce NAT costs?
VPC endpoints cut NAT processing charges when an eligible destination is reachable through a correctly configured endpoint route. The endpoint type decides which services you can reach and what extra charges apply.
| Destination | Candidate route | Cost or configuration condition |
|---|---|---|
| Same-Region Amazon S3 | S3 gateway endpoint | No additional gateway endpoint usage fee; correct source route-table association required |
| Same-Region DynamoDB | DynamoDB gateway endpoint | No additional gateway endpoint usage fee; service and route eligibility required |
| Supported private AWS service | PrivateLink interface endpoint | Endpoint-hour and processed-data fees, plus service-specific DNS and access configuration |
| GitHub or arbitrary external API | Internet-capable egress path | S3/DynamoDB gateway endpoints do not provide the required third-party destination access |
The AWS gateway endpoint documentation describes the route-table relationship. For eligible same-Region service traffic, the gateway endpoint’s prefix-list route takes precedence over the default route, and a more-specific matching IP route overrides it. If traffic still goes through NAT, inspect the winning route as well as the workload subnet’s endpoint association. Validate the route and reachability before you credit the endpoint with avoided NAT traffic.
Interface endpoints have different economics. AWS PrivateLink charges depend on the endpoint type, configured AZs, processed data and Region. Private DNS and security-group reachability decide whether applications can use the endpoint.
Why ECR needs a separate compatibility check
Amazon ECR image retrieval involves the ecr.api and ecr.dkr interface endpoints plus an S3 gateway endpoint for image layers.
With pull-through-cache rules, the first retrieval can still need NAT or internet access. Later retrievals can have different connectivity requirements. The supported path also depends on the image and workload configuration.
Take an ECS Fargate workload that pulls container images from ECR and also calls an external API. Endpoint routes take the eligible image traffic off NAT, while the API traffic keeps using an internet-capable path.
For each endpoint, record the destination service and Region, source-subnet route table, endpoint type, configured AZs, private DNS and security-group requirements, endpoint charges and any NAT path that must stay.
NAT instance, proxy, managed NAT or IPv6: which fits your egress?
Some workloads need public services that the S3 and DynamoDB gateway endpoints cannot reach. For those, the deciding factors are a fixed outbound address, protocol support, availability and who operates the path.
A NAT instance or targeted proxy has a different cost structure from a managed NAT Gateway. It also makes you responsible for capacity, operating-system maintenance, networking, monitoring and recovery.
| Option | Appropriate workload condition | Cost and operational trade-off |
|---|---|---|
| Managed Zonal NAT | Workload requires AWS-managed IPv4 egress with deliberate AZ placement | Gateway-hours, processed bytes and applicable transfer; cross-AZ routes need scrutiny |
| Managed Regional NAT | Managed multi-AZ egress coverage is required | Configured AZ-hours, processed bytes, transfer and possible multiple egress IPs in automatic mode |
| Self-managed NAT instance | Team can operate its own IPv4 egress infrastructure | EC2, IPv4, capacity, patching, monitoring and high-availability responsibility |
| Targeted HTTP(S) proxy | Selected application traffic supports a proxy, such as GitHub downloads | Proxy instance and networking charges, protocol limits and fallback requirements |
| IPv6 egress-only gateway | Destinations and workloads support IPv6 | No separate gateway charge, while applicable data transfer remains billable |
| Retain existing NAT | Proposed alternatives fail a required technical or operational condition | Continued managed NAT cost in exchange for the existing supported egress path |
Say a customer requires requests to come from an approved public IPv4 address. If your application runs multiple ECS Fargate tasks, the egress setup has to keep the IP address the receiving service allowlisted. One operator described that constraint directly:
My client requires my IP address to be whitelisted for network access, but since my application is deployed on AWS ECS Fargate (with multiple tasks), I don’t have a static IP. As a result, I opted for the NAT Gateway to provide one. However, I didn’t expect 60% of the total bill to be consumed by NAT charges, primarily for providing just a static IP.
The operator also reported 64,107.548 GB processed through NAT, $2,884.84 in processing charges and a separate $800 transfer charge.
A targeted proxy suits workloads that support HTTP_PROXY and HTTPS_PROXY, including certain GitHub download flows. Someone still has to own its capacity, supported protocols, credentials, security controls and recovery behavior.
IPv6 is another option. An egress-only internet gateway has no separate gateway usage charge, but internet transfer is still billed. An IPv4-only destination or a client’s fixed IPv4 allowlist rules it out.
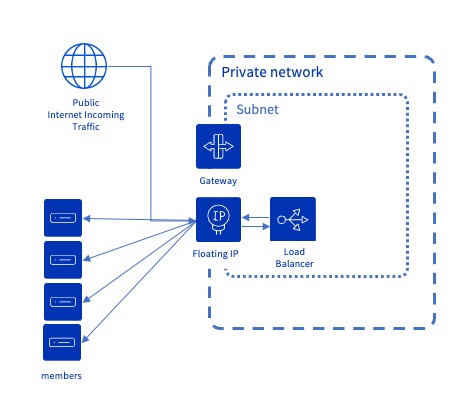
Regional NAT’s automatic address allocation adds Elastic IPs as AZ coverage or connection demand grows. If the receiving service restricts source IPv4 addresses, its allowlist must cover every egress address that can become active. Manual allocation gives you explicit control, and you manage the associations and AZ coverage yourself.
Before you compare prices, test each candidate against these hard constraints:
- Destination and protocol: Can this egress method reach the required service?
- Public address behavior: Does the receiving party require a stable, allowlisted outbound IPv4?
- Capacity and resilience: Can the path carry expected traffic, handle AZ boundaries and tolerate the acceptable downtime?
- Operations: Who owns patching, monitoring, recovery and incident response?
- Residual infrastructure: Which existing NAT gateways or endpoints must stay available?
An alternative that fails a mandatory requirement is out, whatever its hourly price.
How do you calculate the break-even after changing routes?
A NAT change pays off when the whole replacement setup costs less for a comparable workload at an acceptable reliability level. Moving processed bytes off NAT helps, but the remaining gateway, endpoint and transfer charges stay in the calculation.
Use the same measurement period and Region for the baseline and the proposed architecture. Keep traffic demand and availability requirements comparable, so the result reflects the routing decision.
The baseline cost model is:
Current total = NAT AZ-hours × regional hourly rate + NAT-processed GB × regional processing rate + applicable transfer + public IPv4 charges + relevant monitoring and logging
For the proposed change:
Candidate total = remaining NAT charges + endpoint charges + compute and proxy costs + remaining or new public IPv4 charges + changed transfer costs + monitoring + material operating and migration costs
The financial difference is:
Net benefit = current all-in cost − candidate all-in cost
Count public IPv4 charges only where they apply, and don’t double count items already in another line. If the model includes one-time migration costs, state the period you allocate them across.
Cost worksheet
| Cost component | Baseline to record | Candidate treatment |
|---|---|---|
| NAT gateway-hours | Provisioned or configured AZ-hours and applicable rate | Remaining NAT availability after the proposed change |
| NAT processed data | Billed processed GB and rate | Data still routed through NAT |
| Network transfer | Applicable internet and cross-AZ charges | Revised network paths and transfer charges |
| Public IPv4 addresses | Billed NAT Elastic IPs or other public IPv4 addresses | Remaining or new address-hours on NAT, EC2 or proxy resources |
| Replacement resources | Existing endpoints, instances or proxies | New interface endpoint-hours/GB, EC2 compute or proxy expenses |
| Operations and observability | Existing monitoring and logging | New monitoring, maintenance, migration and resilience costs |
Take a private EC2 workload that sends heavy same-Region S3 traffic through NAT while another service needs a fixed outbound IPv4 for an external API. A correctly associated S3 gateway endpoint diverts the eligible S3 traffic and cuts NAT data processing. The external API keeps using NAT, so the gateway-hour charges stay.
Compare interface endpoints separately. Their hourly charges add up across configured AZs. At low volumes, the fixed endpoint cost can outweigh the NAT processing you save, while higher eligible volumes give a different result.
Calculate the break-even with your Region, endpoint type, address count and observed traffic volume.
For a broader estimate of the workload’s infrastructure costs, see the cloud computing cost model, which covers compute hours, storage usage and network egress.
How do you change the network path without an outage?
Changing NAT architecture changes application connectivity. Endpoint insertion, default-route changes, proxy deployment and gateway replacement each affect a different part of the outbound path. Start with a defined change scope and a known recovery path.
Before you start, check four things:
- Routing: Identify the source subnets and route tables affected, including any S3 prefix-list entry or default internet route that will change.
- Endpoint access: Review private DNS behavior, security groups, endpoint AZ configuration and permissions for the services involved.
- Infrastructure changes: Inspect Terraform or other infrastructure-as-code plans for gateway recreation, route replacement and dependent resource changes.
- Recovery: Define application smoke tests, service-health checks, a rollback route and the operator who executes it.
Amazon ECR documentation describes a further risk when you add an S3 gateway endpoint: existing S3 connections can briefly drop as the route changes. If your deployment depends on ongoing image or storage access, schedule a change window and prepare recovery.
The rollback must preserve the original required destinations and security behavior.
How do you prove savings and catch the next spike?
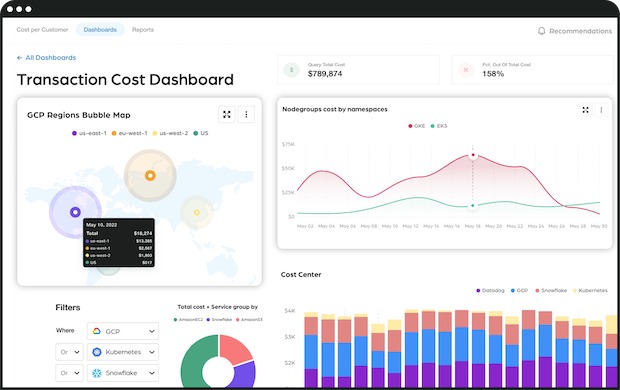
After the change you need two kinds of evidence: a lower comparable all-in bill and continued application connectivity. NAT metrics show less traffic passing through a gateway, but the cost may have moved to PrivateLink, EC2, public IPv4 or another network-transfer category.
Compare billing periods with similar workload demand and the same account, Region and usage dimensions. Look at the charges that fell next to the new or larger charges from the replacement path.
CloudWatch gives faster signals. NAT Gateway metrics arrive at about one-minute granularity, so traffic changes, connection behavior and certain errors show up sooner than cost reporting. For anomaly monitors, spend alerts and Cost Explorer, see how to investigate AWS cost anomalies and alerts.
Watch these metrics:
- Traffic: NAT byte counters show changed traffic levels after routing changes.
- Connections:
ActiveConnectionCountshows connection behavior. - Failures: NAT error and packet-drop indicators, including
ErrorPortAllocationwhere it applies. - Application health: Connectivity and service errors for the workloads affected by the change.
Why billing alerts need an operating counterpart
AWS Cost Explorer generally refreshes its cost data at least daily. The AWS Cost Anomaly Detection documentation describes anomaly processing about three times a day once cost data is available, so detection can take up to 24 hours after usage.
An application can push heavy outbound traffic within a few hours, so that lag matters.
One Reddit poster found the cost of sustained external API traffic only after heavy charges had piled up:
We recently discovered that a single NAT Gateway in ap-south-1 racked up 4 TB/day of egress traffic for 30 days, burning $9.7 k before any alarms fired. It looked “textbook safe” (2 private subnets, 1 NAT per AZ) until our finance team almost fainted.
Give each signal its own owner. Engineering investigates network activity and service failures. A cost or FinOps owner reconciles the resulting AWS charges and responds to budget notifications. For cloud billing, cost allocation and engineering owners, use the FinOps cloud-cost operating cycle to compare requirements.