
For engineering owners and FinOps practitioners, the first cloud-cost change should be the one with the strongest net benefit at a reliability risk you can accept, not the one with the biggest projected saving. If ownership, peak-load evidence, or the future usage baseline is uncertain, hold off on irreversible changes and long commitments. Document the baseline, test a reversible option, and measure cost per unit of useful work once the billing data settles.
Find the cost driver and the person responsible for it
A large cloud bill tells you where money was charged. It rarely tells you which deployment, application, or business activity deserves attention. Before you propose a shutdown or a smaller instance, tie the spending to a workload that somebody recognizes and owns.
Use AWS Cost Explorer, Azure cost reports, or your provider’s billing data to find the account, service, region, and time period involved. An EC2, storage, or networking line item only starts the investigation. What you need to know is which application or environment generated the charge and who has authority to change it. For CUR 2.0, Cost Explorer, and AWS invoice mismatches, see how to reconcile AWS Cost and Usage Reports.
Cost allocation tags link resources to teams, applications, environments, and cost centers. Showback shows spend to the responsible teams. Chargeback bills it internally under the organization’s accounting approach. Shared infrastructure needs allocation rules beyond tags. The checks for resource tags, AWS accounts, and billing allocations are in the AWS cost allocation tag audit checklist.
Engineering knows what the service has to do. FinOps knows what it costs after discounts.
One FinOps practitioner explained why monthly reports got ignored:
What actually started working was making cost data accessible in the context of their real work, stuff like cost per environment and cost per service and showing the delta after a deployment goes out, and when an engineer can see that their PR increased daily spend by 200 bucks they suddenly care a whole lot more than when you send them a monthly spreadsheet that goes straight to archive.
Build one baseline row for the billing account, service, region, environment, time window, effective spend, accountable owner, and useful workload output where known. Mark unknown fields. If a resource’s purpose is unexplained or its owner is missing, do not make a destructive change.
Effective or amortized cost matters when discounts and commitments change what you pay. Comparing a new configuration at a retail rate with an existing workload billed under a commitment gives a misleading estimate.
If you need a full spending estimate before optimizing, the cloud cost calculation guide covers compute hours, storage usage, and network egress.
Compare the cost-cutting levers before touching resources
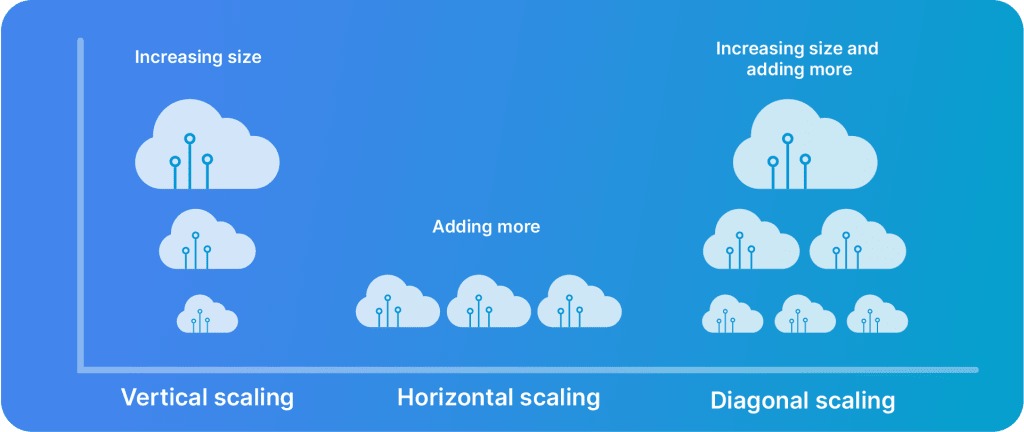
Cloud cost optimization covers several different kinds of change. Removing an unneeded resource cuts billed usage. Scheduling changes when capacity runs. Rightsizing changes the resources a workload gets. Rate optimization lowers the price of eligible consumption. Architectural optimization changes how a system uses services.
| Optimization lever | Appropriate conditions | Reason to defer | Financial mechanism |
|---|---|---|---|
| Remove unused capacity | Owner confirms the resource has no continuing purpose | Unknown dependencies, retained state, standby or disaster-recovery role | Eliminate avoidable usage and ongoing charges |
| Schedule nonproduction resources | Predictable inactive periods and acceptable startup behavior | Unpredictable jobs, always-on testing, slow startup | Reduce billed runtime |
| Rightsize or scale | Representative workload data supports a capacity change | Unknown peaks, memory, I/O, network or availability requirements | Match provisioned capacity to demand |
| Purchase a commitment discount | Stable eligible usage is expected to continue | Planned shutdown, migration, declining demand | Reduce the rate paid for eligible consumption |
| Change network or storage architecture | A specific inefficient usage path or storage pattern is identified | Uncertain transfer, retrieval, endpoint or operating costs | Change the composition of billed usage |
An idle resource is not always abandoned. A dormant replica may be your disaster-recovery copy, and an unused-looking volume may hold data you must retain. The owner has to separate deliberately reserved capacity from abandoned infrastructure.
Scheduling suits development environments best. If your team works in predictable hours, running the environment overnight is avoidable cost. Overnight integration tests, unscheduled work, or long startup sequences change that answer.
AWS Compute Optimizer gives EC2 recommendations based on observed instance specifications and utilization, and it classifies instances as overprovisioned or underprovisioned. It does not cover every EC2 instance type. Treat its output as a list of candidates, and let workload constraints decide which ones qualify.
For a rightsizing candidate, check CPU, memory, disk I/O, network behavior, and peak demand. A database with low average CPU can still depend on its memory or face heavy I/O at a business peak.
Build a shortlist by recording each resource’s purpose, workload pattern, required uptime, statefulness, dependencies, and the levers it can tolerate. Drop incompatible options before you compare projected returns.
Rank the next change by net benefit, effort, and reversibility
Start by excluding candidates with unconfirmed ownership or an unresolved safety requirement. Then give each remaining candidate one decision: test, approve, defer, or reject.
The FinOps Foundation’s Usage Optimization framework connects cost decisions to business value, workload performance, engineering effort, risk, and continuing measurement.
Judge each candidate on five factors:
- Financial effect: How much will spending change after existing discounts, extra service fees, and overlapping recommendations?
- Implementation effort: How much engineering work, coordination, migration, and ongoing administration does it take?
- Risk to service: Which users, dependencies, service-level objectives, or stored data could it affect?
- Reversibility: How easily can you restore the original configuration and behavior?
- Evidence: Do actual observations support the ownership, usage pattern, baseline, and expected change?
Here are three examples:
| Candidate change | Evidence and expected benefit | Operational considerations | Initial decision |
|---|---|---|---|
| Schedule an idle development environment | Known inactive hours; financial amount to establish | Owner-confirmed, startup dependencies manageable, reversible | Test |
| Downsize a production database | Projected capacity saving; seasonal peak I/O unknown | Customer-facing service, uncertain performance headroom | Defer |
| Modify an expensive network route | Identified billed component; alternative cost uncalculated | Availability Zone placement, dependencies, new operating costs | Defer |
You can test the development schedule: the idle hours are known, the owner has approved it, and reverting is simple. The database change stays deferred while seasonal I/O demand is unknown, even though its forecast saving looks larger. The network route waits until you have priced the alternative.
For a candidate that passes, write a short change card:
- Decision authority: Link the workload owner and baseline, and name the engineer who approves the proposal.
- Candidate and alternative: Describe the change, a less disruptive option if one exists, and the engineering hours or bounded effort range it needs.
- Decision and measurement: Record test, approve, defer, or reject, and who will assess the result.
Decide when to right-size before buying a commitment
Usage optimization changes how much a workload consumes. Rate optimization changes the price of eligible consumption. Azure Advisor’s savings methodology recommends resizing or shutting down underused resources first, then evaluating reservations, then savings plans. Updated commitment recommendations are expected within three days of a usage change.
The FinOps Foundation explains that waiting until every resource is optimized may sacrifice worthwhile discounts, so a limited commitment can make sense for a dependable future baseline.
Before you commit now or re-estimate later, compare that baseline with planned shutdowns or migrations, existing discounts, eligibility, coverage, term, and unused obligations. The Savings Plans versus Reserved Instances comparison covers the product details, including utilization coverage.
Investigate network charges before redesigning the route
Network billing can reveal costs you cannot tie to a single application. In AWS, NAT Gateway pricing combines provisioned gateway hours with the amount of data processed, so both keeping a gateway and sending traffic through it cost money.
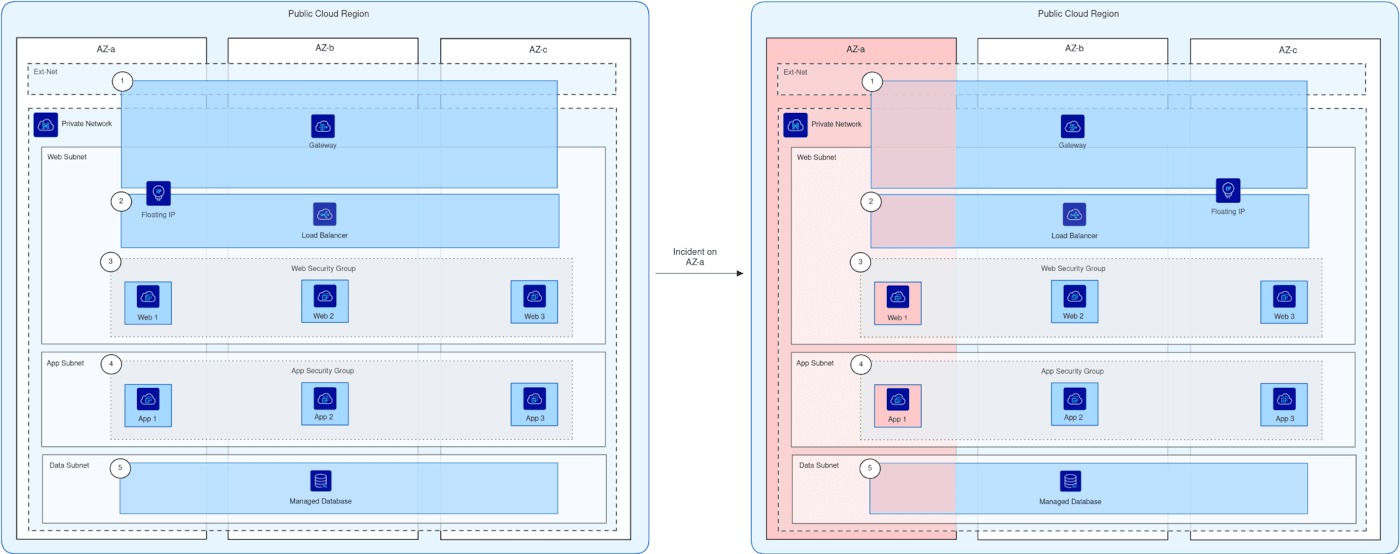
A development environment with sporadic outbound traffic still pays for every hour its gateway stays up. A busy production environment spread across Availability Zones has a different problem: moving or consolidating a gateway can change cross-zone traffic costs and resilience.
One developer checked Cost Explorer and got a surprise:
We’re on AWS Activate credits and just realized NAT Gateway (hourly plus data processing charges) is eating up about 80% of our total AWS spend. Didn’t expect it to be anywhere near that high until we actually looked at Cost Explorer.
VPC endpoints change the path traffic takes to supported services. Gateway and interface endpoints apply to different cases and are charged differently, and the right choice depends on traffic destination and network topology. A self-managed NAT instance adds patching, scaling, maintenance, and availability work that your team must be equipped to handle.
Map the source subnets, destination services, Availability Zones, gateway hours, processed gigabytes, and related transfer charges. Then compare the current route with each proposed endpoint, extra gateway, or self-managed option, using your region’s prices. Include operating cost and resilience in that comparison: a lower infrastructure charge is a poor bargain if it shifts failure risk or maintenance work onto the application team.
For the complete AWS-specific diagnostic, see the NAT Gateway cost analysis, which covers NAT gateways, VPC endpoints, and egress traffic.
Apply a production safety gate before changing capacity
A projected saving does not excuse you from protecting performance, availability, and recoverability. A production capacity change needs a go/no-go decision based on workload behavior and what failure would cost.
For a production database, look at CPU alongside memory demand, storage I/O, network throughput, and the application’s busiest representative periods.
Latency at the 95th or 99th percentile, error rate, throughput, and workload-specific resource limits show whether a smaller configuration leaves enough headroom. Your service’s own objectives set the thresholds.
AWS Compute Optimizer builds its recommendations from historical utilization, so they cannot show that a future seasonal peak, dependency failure, or unusual workload will fit the proposed instance.
The production change gate has six parts:
- Authorized owner: Someone accountable for the service approves scope and timing.
- Dependency and state review: You understand connected services, stored data, retention requirements, and standby or failover capacity.
- Load evidence: Measurements cover real peaks and the resources the change could constrain.
- Service guardrails: SLOs, latency, throughput, error-rate conditions, and monitoring responsibilities are defined.
- Recovery route: Backup and restoration feasibility, configuration rollback, and decision authority are settled.
- Controlled execution: You use a canary, staged rollout, or maintenance window, with explicit stop conditions.
Some changes cannot be safely reversed, including certain destructive data operations. A rollback assumption is not enough for them. They need a qualified operational plan that covers recovery and the consequences of failure.
Missing peak evidence, unexplained dependencies, or untested recovery put a disruptive capacity change in the deferred category.
Measure realized savings without adding overlapping forecasts
A recommendation’s estimated savings are a forecast, a configuration change is an implementation, and only a lower bill measured on a comparable basis after the change counts as an observed result. Mixing these up leads you to count unrealized estimates as savings and to count the same reduction twice.
AWS Cost Optimization Hub accounts for overlapping opportunities in its aggregated estimates. If one EC2 instance has recommendations to delete it and to rightsize it, you can carry out only one of them, so the two projected savings cannot be added together.
Commitment discounts add another source of discrepancy. A resource resized under an existing discounted rate can save a different amount than an estimate built on retail pricing. Azure Advisor also documents different calculation bases for some usage and commitment recommendations.
The ledger below keeps the stages separate:
| Stage | What the record contains | Evidence required | Meaning |
|---|---|---|---|
| Forecast | Candidate intervention and expected incremental saving | Utilization, rates, assumptions, interactions | Estimated opportunity |
| Implementation | Resource change, date, affected service and deployment | Configuration or change record | Action performed |
| Technical result | Capacity, throughput, latency, errors and workload output | Comparable monitoring observations | Operational outcome |
| Financial realization | Total effective spend change and cost per comparable useful unit | Processed billing, completed work, service-quality results | Dollar savings and efficiency reported separately |
For an application with measurable output, use this calculation:
Cost per useful unit = attributed effective cloud cost / useful completed units
The unit might be a successful customer transaction or a completed processing job. The numerator must use the discounted or amortized cost basis, and the denominator must count comparable useful work.
A drop in attributable effective spend is a realized dollar saving when the comparison accounts for changes in workload, rates, and other costs. A lower cost per completed transaction is an efficiency gain. If a service processes more transactions while its bill rises, per-transaction cost can still fall. That comparison holds only when transaction mix and service quality stay comparable.
Mark dollar savings as realized once enough processed billing data supports the comparison, and report any unit-efficiency gain separately.
Keep savings from disappearing and catch cost surprises
Your first successful optimization does not change how new infrastructure gets provisioned or managed. A service you resized carefully can still grow more expensive through new deployments, rising demand, or resources that outlive their original purpose.
One contributor to r/Cloud named the mistakes that let waste return:
Focusing only on infra, not behavior. Engineers can spin things up easily, but there’s no clear feedback on what it costs. If devs don’t see cost signals, waste comes back fast. Optimizing without understanding usage. I’ve seen teams downsize instances or move storage tiers without looking at traffic patterns, which leads to performance issues or “savings” that cause problems elsewhere.
Anomaly monitoring adds a separate layer of detection. AWS Cost Anomaly Detection evaluates processed cost information approximately three times a day, while the underlying Cost Explorer data can lag usage by up to 24 hours. A cost anomaly notification is therefore a delayed financial signal, not an immediate spending cutoff.
Assign each service a cost owner, a review cadence that fits how often deployments and demand change, a trigger for reopening optimization work, and a person who responds to anomalies. Then check that notifications reach the right recipient and that an unexpected spending change leads to a defined investigation.
The detailed setup and investigation workflow lives in the AWS cost anomaly detection guide, which covers anomaly monitors, spend alerts, and Cost Explorer.