
Keep your existing cloud billing and engineering tools if they reconcile spending, assign costs to the right owners, and push people to act. If one of those is missing, shortlist software that fills that specific gap and buy only after testing it on your billing data, your workflow, your security requirements, and the full cost of owning it. The best candidate is the one that passes those tests, even if another product has a longer feature list.
Cloud cost management software covers several jobs. Some products consolidate bills and allocate shared spending. Others find infrastructure waste, support commitment decisions, forecast expenses, or tie cloud charges to customer activity.
Two platforms can both claim FinOps capabilities and still answer different questions for the people who use them. Good software finishes the task with the data and process you already have.
What do you need cloud cost software to do?
Define the outcome before you compare products. Visibility, financial allocation, anomaly investigation, forecasting, and infrastructure optimization are different decisions.
The FinOps Foundation’s guidance on tools and services ties software decisions to organizational outcomes, integration requirements, and ongoing value assessment. It gives you a way to decide whether another platform has a purpose.
A finance team may have accurate invoices but struggle to split shared infrastructure costs between departments. An engineering team may know which service got more expensive without knowing what to change. A product team may want cost per request, which works only if reliable request counts can be matched to the spending in scope.
Before you talk to vendors, write one statement describing the missing outcome, name the person responsible, and pick up to three pass/fail conditions. Three keeps the evaluation manageable.
For a cloud engineering organization, those conditions could be:
- Cost ownership: You can assign shared service expenses to the right teams, with the unallocated remainder visible.
- Operational response: You can trace an unexpected charge to an accountable engineer and a documented investigation.
- Financial confidence: The reporting system explains differences between its results and provider billing records.
Finance, engineering, and product stakeholders should each find what they need. A platform with attractive reports and unresolved responsibilities is one more system to maintain.
If one person already manages both spending and infrastructure in a single account, you already meet these requirements without buying another product.
When are native billing tools or spreadsheets enough?

Native cloud billing tools are a reasonable place to start when you have usable reports, consistent ownership rules, and a reliable process for acting on findings.
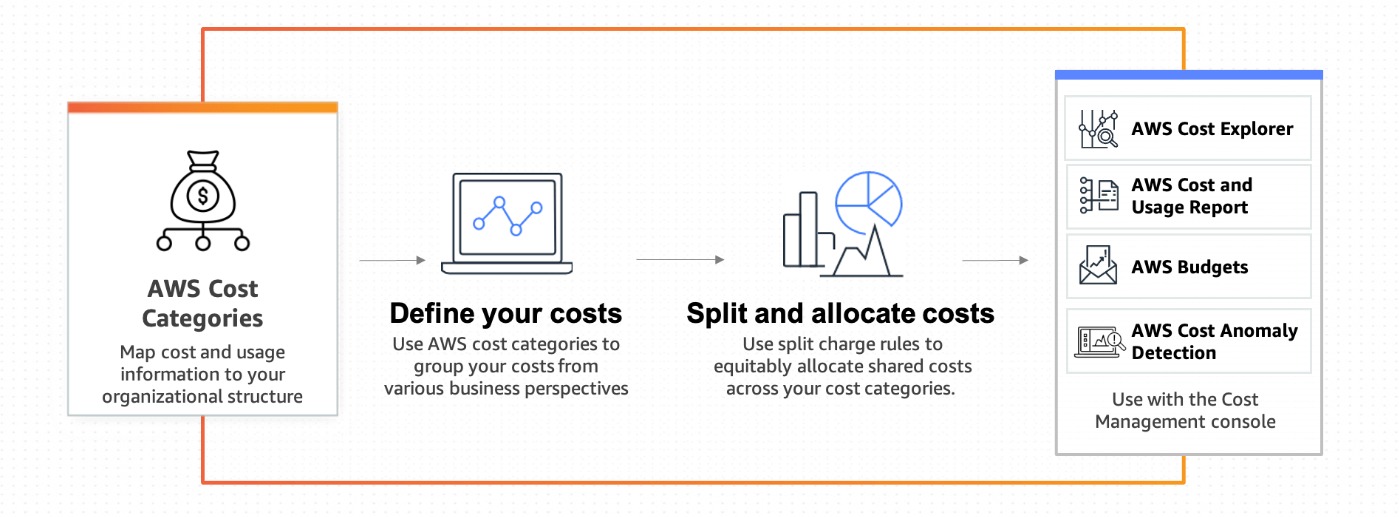
AWS Cost Explorer, provider billing exports, existing business intelligence software, and spreadsheets can cover parts of the FinOps workflow without a dedicated commercial platform.
AWS Cost Explorer documentation describes free access through its user interface. Primary billing-view API requests cost $0.01 per paginated request, while custom billing-view requests are priced at $0.01 per source.
Google Cloud Billing exports to BigQuery can create storage and query costs. Google’s linked FOCUS dataset has a documented storage exception for the most recent two years; queries and customer-owned copies can still incur charges.
A spreadsheet is enough while data volume, team ownership, refresh frequency, and financial controls stay manageable. It breaks down when allocations depend on many inconsistent accounts, manual mappings, or repeated reconciliation work.
One r/FinOps contributor described a large cost-reduction effort followed by a question about maintaining accountability over time:
I get the purpose of FinOps. I was a DevOps engineer a few years ago, and all of a sudden out of nowhere we were spending $200,000 a month on AWS. Then we needed to get to $30,000, and thankfully I did it. I’m just curious. It feels like it’s extremely valuable, but how do we prevent silos from happening again? Are there any tools that people like used for this space, or is it just spreadsheets? I used the spreadsheet back in the day. I’m just curious.
The real purchasing question comes after the cleanup: who keeps the cost mapping useful, spots new problems, and sends them to the responsible team?
Produce one needed report with your existing system, using the outcome you defined earlier. Record the answer, its owner, the effort required, and any extra provider API or data-processing charges. If the current setup can’t produce the result at a sensible cost, that gap defines your next software evaluation.
Native reports also cover only their own provider. If you need one allocation policy across several clouds, you need extra integration or a dedicated platform.
Which category of tool fits the job?
Pick a category by the financial or engineering decision it supports. The label cloud cost management covers products with different data requirements and operating models.
| Category | Primary job | Example to investigate | Reason to reject |
|---|---|---|---|
| Native billing and BI | Provider spending visibility and manageable reporting | AWS Cost Explorer; Azure Cost Management | It can’t cover the accounts, sources, or reporting workflows you need |
| Broad FinOps and allocation | Cross-account reporting, shared costs, showback, chargeback | Vantage | It can’t represent your allocation and ownership rules |
| Kubernetes cost specialist | Attribute shared cluster spending to namespaces or workloads | OpenCost | Cluster cost allocation is immaterial or already handled well |
| Commitment and rate management | Evaluate discounts against committed usage and flexibility | Provider commitment analysis as the baseline | Your demand is too uncertain for the proposed commitment |
| Observability-linked cost | Connect resource behavior with spending and technical action | Datadog Cloud Cost Management | Engineers can’t turn its output into an action |
| Unit economics | Assign infrastructure cost to customer or product activity | CloudZero | No reliable business activity count exists |
Categories overlap. A broad FinOps platform can include Kubernetes allocation, forecasting, or anomaly features. Use the requirements from the first section to pick one or two tracks to investigate.
The gap between infrastructure efficiency and financial planning shows up in a firsthand account from an engineer who was handed FinOps responsibilities after cutting cloud waste:
This is my first year DevOpsing, and I kind of took it as a challenge to reduce our cloud bill, mostly as an exercise for myself. Tuning requests and limits, cleaning up idle resources, pushing for better utilization, all that. So management Good Will Hunting’d me and said, “Oh you like apples? How do you like them apples?” and gave me full FinOps responsibilities. Now this is a completely new world for me. I used to work on scaling behavior, instance types, cluster efficiency, etc. Now I’m expected to have an opinion on how much we should commit, how to model future usage, how to balance flexibility vs discounts, how to talk to finance… It’s a different muscle entirely and doesn’t feel like my forte. So while I’m reflecting on the mistakes that led me here, I’ve got a couple of questions for anyone who made the jump from pure DevOps into FinOps territory: Where did you start? Any hard lessons you can help me avoid? Any blog/podcast/book I should watch/read/listen to?
Rightsizing a workload, buying a Savings Plan, and allocating a department’s shared costs call for different analyses. A tool that suits one of these decisions doesn’t necessarily suit all three.
Which disqualifiers should end a vendor demo early?
A product should pass the essential data, accounting, access, and governance requirements before you look at its advanced features. A demo shows the vendor’s best case. Your own data shows what you’d actually get.
| Hard gate | Required demonstration | Failure condition |
|---|---|---|
| Source coverage | Access to necessary accounts, subscriptions, projects, and cost sources | Required spending is excluded |
| Cost definitions | Relevant billed, effective, amortized, credit, and adjustment fields | The accounting basis you need is missing |
| Ownership | Team identities, shared-cost rules, and unallocated balance | It can’t identify the teams or products you need |
| Data portability | Usable exports and documented history and retention terms | You can’t recover or transfer critical records |
| Initial access | Reporting permissions compatible with the trial | It demands unnecessary administrative privileges |
| Governance | Required SSO, role separation, and logging | It can’t meet a mandatory company policy |
| Interoperability | Verified schema, version, field mapping, and import/export direction | It drops required source fields without a clear explanation |
The FinOps Open Cost and Usage Specification (FOCUS) defines a common model for cost and usage information. Version 1.4, ratified June 4, 2026, added Invoice Detail and Billing Period datasets relevant to invoice reconciliation. Check a vendor’s FOCUS compatibility by version, supported datasets and columns, and direction of data exchange.
Label each must-have requirement Pass, Fail, or Unknown. Unknown stays open until the vendor provides a proper artifact or the trial produces usable evidence.
Say two teams share a service and you require an auditable cost allocation. A platform that imports the total charge but can’t express that ownership rule fails the gate, however many charts it has. Stop evaluating a candidate once a required gate fails.
Can the tool reconcile and allocate your actual cloud bill?
Invoice reconciliation is the decisive financial test. The software must account for agreed source charges, explain differences in reporting basis, and show where shared or unassigned expenses end up.
Choose one billing period and define its scope. Record the accounts, currency, reporting time zone, and whether the bill is finalized or provisional. Decide which components enter the comparison: base usage, commitments, discounts, credits, refunds, taxes, support, and later adjustments can appear differently across provider views. The checks for CUR 2.0, Cost Explorer, and AWS invoices are explained in how to reconcile AWS Cost and Usage Reports.
Match the cost basis before comparing totals
Billed cost covers charges assigned to a billing period. Effective and amortized presentations distribute commitments and discounts differently. Compare only matching definitions and billing periods.
Say your AWS export shows $52,000 and the tool shows $51,200. If the $800 gap is a credit the tool excludes, it’s explained. A gap nobody can explain is a fail.
| Component | Provider record | Tool result | Required explanation |
|---|---|---|---|
| Base usage | Charges within agreed scope | Corresponding normalized charges | Account, service, and period mapping |
| Commitments and discounts | Relevant rate or commitment entries | Comparable representation | Billed, effective, or amortized treatment |
| Credits and refunds | Financial adjustments | Included or explicitly excluded | Accounting treatment |
| Tax and support | Applicable invoice components | Included or explicitly excluded | Scope consistency |
| Shared service cost | Original scoped shared charge | Assigned owner amounts | Documented allocation rule |
| Unallocated remainder | Expenses without a valid owner | Visible outstanding balance | Missing tags or allocation limits |
For each comparable line, calculate difference = tool value − matched provider value. Use your financial materiality threshold to decide which unexplained differences need investigation. FOCUS 1.4 also defines rounding-variance tolerance for reconciling high-precision usage records with rounded invoice totals. That technical precision rule and your materiality threshold cover different kinds of differences.
Test a shared-cost exception
Use one shared service assigned to two products or teams. Include a missing tag, a credit, and a late-arriving charge. The expected relationship is allocated owner costs + unallocated remainder = scoped shared expense under the documented allocation rule and a consistent cost basis.
Now change a resource’s ownership mapping. Check whether the platform recalculates historical reports, preserves earlier allocations, or applies the new rule only going forward.
Datadog’s documentation shows why this matters: its default retrospective processing window is up to three months for tag pipelines and one month for allocation rules, with separate conditions for older-data backfills.
Keep the reconciliation reproducible
Save the source export, normalized report, field transformations, allocation rules, unexplained differences, and responsible reviewer. A provisional usage estimate can differ from the finalized invoice when late usage or adjustments haven’t arrived yet.
Hold off on allocation or chargeback approval while a material discrepancy stays unexplained.
Will engineers act on its alerts and recommendations?
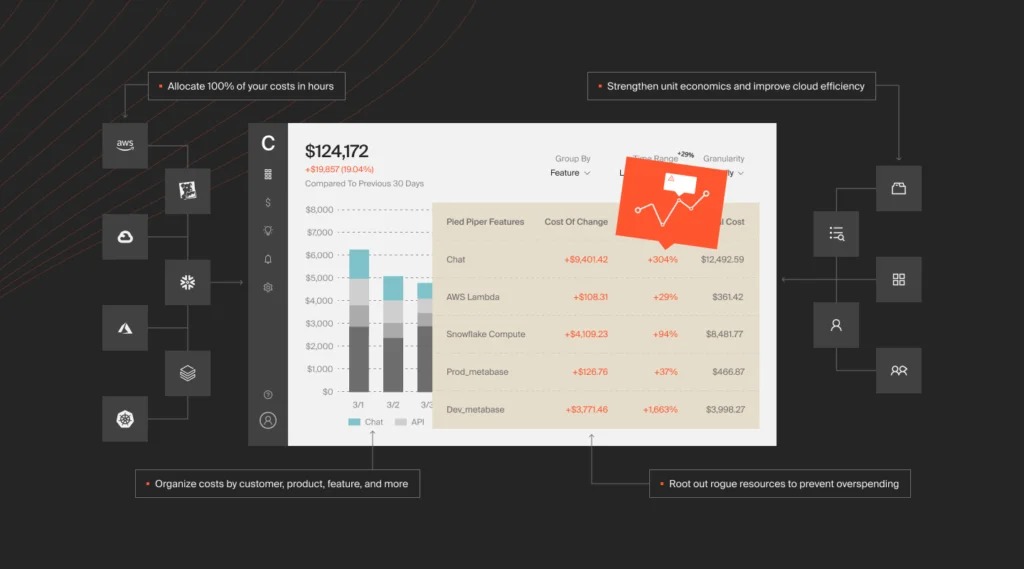
A cost alert is useful when it points to something an accountable engineer can investigate and ties that investigation to an operational response.
The FinOps anomaly-management framework covers detection, notification, ownership, and investigation. Resource identifiers, environment labels, service ownership, and likely cost drivers turn a financial signal into technical work. For anomaly monitors, spend alerts, and Cost Explorer changes, how to investigate AWS cost anomalies and alerts covers the constraints.
An Azure user described trying two cost platforms that finance liked but engineers rarely used:
Serious question because I’m starting to think this is impossible. We’ve tried two different cost management platforms over the past year and both times the same thing happens: i set it up, finance loves it, engineering team looks at it once and never touches it again. The problem isn’t that engineers don’t care about costs, it’s that these tools feel like they’re built for a completely different audience. Everything is in finance terminology, the ui feels like a business intelligence dashboard from 2015, and the insights are too high level to be actionable. “your azure costs increased 15% last month” okay cool, what am i supposed to do with that information? we’re spending around $70k/month on azure (app services, sql databases, storage, some vms, aks cluster) and i know there’s waste but i need help identifying where. Azure cost management shows me the numbers but doesn’t tell me what to actually do about them. tried Azure advisor but the recommendations are pretty basic stuff we’ve already done.
The author asks for better App Service sizing details, storage lifecycle analysis, and unused premium-feature identification. Those are the investigations to test.
Replay a known incident
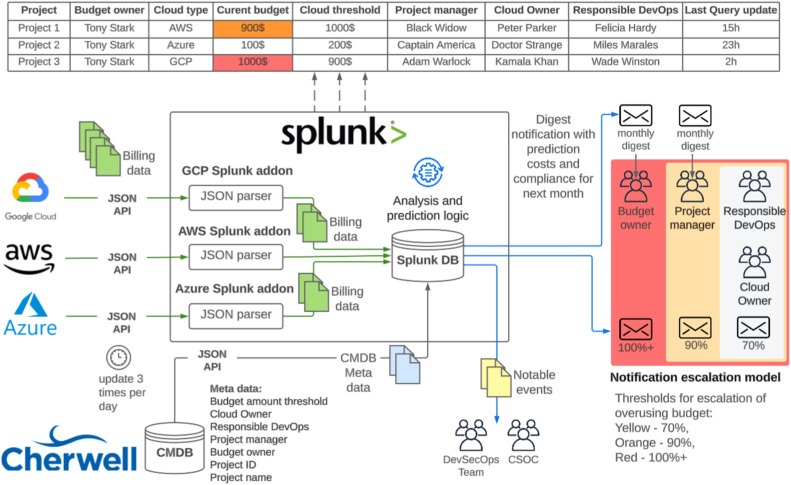
Pick a historical spending anomaly with a known investigator or responsible team, and run its records through a finalist’s supported process.
- Source availability: When the provider made the cost data available.
- Detection: When the platform identified the unusual charge or usage pattern.
- Notification: Where the event was delivered.
- Ownership: Which engineer or team received it.
- Investigation: The resource, suspected driver, and any false positives.
- Action: The ticket or change record, effort, and subsequent measured effect.
Those timestamps separate provider reporting delay, platform processing delay, and internal response delay. A tool that posts into an existing engineering channel faces different adoption demands than a dashboard people must remember to open.
Have finance and engineering reviewers answer their own questions independently. Record whether they reach the same incident and how much work the investigation takes.
Does its forecast or special optimization fit your workload?
Forecasting deserves its own trial when future spending drives budgets or commitments. Historical trends can miss planned releases, migrations, seasonality, and shifts in demand.
A contributor in r/FinOps described the frustration of forecasts that could not account for planned business changes:
Every tool shows you a forecast of next month’s costs but they’re always wrong by like 30-40% which makes them basically useless for budget planning. They just extrapolate recent trends linearly which doesn’t account for seasonality, upcoming changes or any actual business context Q4 costs are always higher because holiday traffic, january costs drop because everyone’s on vacation but forecasts just see the december spike and predict january will be even higher. Then finance gets mad when actual costs are lower than the forecast and questions why the budget wasn’t fully used Major launches, migrations, architecture changes all invalidate forecasts immediately but most tools don’t let you input this context, they just mindlessly project based on historical data. You could manually adjust forecasts but then you’re spending hours every month second guessing the tool’s predictions which defeats the purpose of having a tool
Put a planned change into the forecast
Give a finalist a historical baseline and a known change, such as an application release, migration, or seasonal traffic increase. When the matching actual period is available, compare costs under the same reporting scope.
forecast variance = actual comparable cost − forecast cost
Inspect the variance, the assumptions, and whether the product can explain and revise the forecast.
Commitment planning is a different financial decision. Savings Plans and Reserved Instances offer discounted rates for qualifying usage in exchange for a commitment, while rightsizing changes the infrastructure you use. A commitment analysis has to cover baseline stability, flexibility, and financial exposure.
Evaluate specialized features only when you need their outputs. Kubernetes allocation covers shared cluster ownership. Unit economics relates infrastructure spending to business activity, a method CloudZero documents:
unit cost = scoped cloud spend ÷ matching business activity
For cost per request, the request count and cloud spending must cover the same workload and measurement period.
What access and automation controls are safe enough to approve?
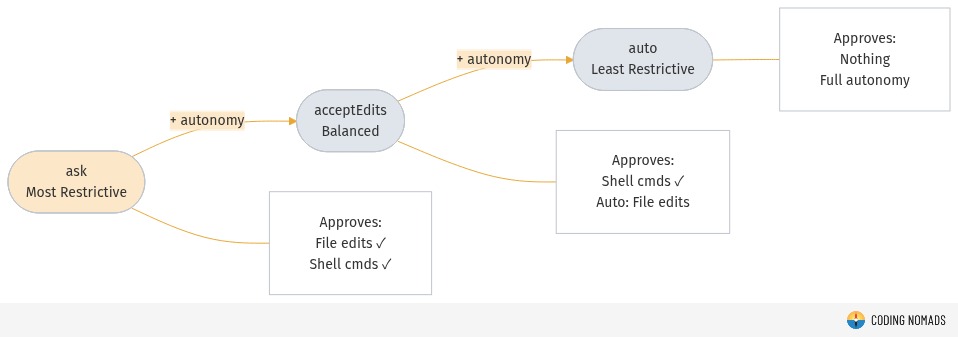
Read-only billing analysis, telemetry collection, and write-enabled infrastructure changes each need their own permission decision. Document connector roles and account access before deployment.
Have security and operations reviewers check least-privilege access, SSO, role separation, logging, data retention and deletion, and export controls against company policy.
If the product can shut down resources, resize infrastructure, or purchase commitments, approvals must cover service availability, authorized operators, change records, and rollback where possible. The responsible security or operations owner approves the permission and automation worksheet before you activate write-enabled functionality.
What will it cost to own, and can you leave?
The advertised subscription is only one part of total ownership cost. Integration, provider-side data charges, staff time, renewal terms, and the cost of leaving the platform can change the decision.
Cloud cost products use spend-based tiers, feature packages, seat limits, or custom quotes. Compare prices only on the same account coverage, usage levels, reporting requirements, and contract scope.
Vantage publishes Starter, Pro, Business, and Enterprise pricing tiers. CloudZero uses custom quotes, so you need a written offer covering your workload and service scope to compare it.
Use one agreed comparison period, such as 12 months, with the actual supplier terms.
| Ownership component | Amount or obligation to collect | Cost or risk to recognize |
|---|---|---|
| Software subscription | Quoted license, consumption tier, users | Recurring platform charges |
| Initial integration | Billing connectors, mapping, onboarding | Implementation work |
| Provider-side processing | API requests, storage, exports, queries | Costs beyond the software subscription |
| Internal operations | Allocation maintenance, investigation, administration | Staff time |
| Support and retention | Support level and retained history | Recurring or additional charges |
| Renewal and exit | Cancellation, exports, deletion, renewal conditions | Switching costs and contractual exposure |
Value is the documented extra benefit minus the extra cost of ownership. Put the effort of keeping your native reports running into the baseline, because some of that work continues after you buy a platform.
Separate estimated and realized savings
A recommendation may list possible reductions from idle resources, lower rates, or another configuration. Credit savings to the software only after you implement the change, measure its financial effect, and exclude overlapping savings. For rightsizing, idle capacity, and network charges, see the cloud cost optimization change checklist.
net incremental value = documented incremental benefit − incremental ownership cost
A higher subscription is justified when attributable benefits or reduced operating effort exceed the added expense. It’s wasted money if your existing processes already cover the same work.
Test the exit before signing
Check the contract for ownership of historical records, export formats, retention periods, cancellation and renewal terms, and deletion responsibilities. Request a representative export that includes the fields you need to preserve your allocation history.
How do you run a proof of concept and make the decision?
A proof of concept is a bounded exercise built on your requirements, source data, and responsible people. Its output is a purchasing decision backed by reproducible records.
A 30-day calendar is one planning option when access, bill freshness, and procurement allow it. Some trials need less time; others need a finalized billing period or a record of planned workload changes.
Collect the results from the source-data, allocation, incident, permissions, and economic evaluations in one decision record: the business requirement, native baseline, candidate evidence, hard gate status, traceable operational value, extra cost, and decision. Each material conclusion should point to a billing extract, permission approval, incident record, or written commercial term. If resource tags, AWS accounts, or billing allocations affect your decision, the AWS cost allocation tag audit checklist covers the constraints.
Weigh the survivors
For candidates that pass every gate, assign weights that reflect your real priorities. Finance-led teams tend to weight allocation and reconciliation; engineering-led teams weight incident detail and integration.
Compare each paid finalist with the existing-tool baseline. A second finalist helps when it’s a realistic alternative. Record one of four outcomes:
- Buy: Every hard gate passes and the extra value is justified.
- Extend existing tools: Native reports or existing workflows deliver the required result at acceptable cost.
- Reject: A mandatory requirement fails, or commercial and operational constraints are unacceptable.
- Retest: A material question remains open and a narrower evaluation can settle it.
Assign an operator, a financial owner, and a date to reassess the result.
Run the agreed trial and record the decision before you commit.