
If you run a US data center, treat PUE as a trend in facility overhead, not as a verdict on efficiency. Choose the change that cuts measured energy and other material costs without weakening cooling or power resilience. If IT load, weather, or metering scope differs between two periods, the comparison is provisional. Start by auditing your meters and recording a matched baseline for energy, water, and workload.
A data center can report a better Power Usage Effectiveness (PUE) figure while consuming more electricity. Its cooling system can use less power while drawing more water. A change that cuts a fan’s energy demand can also shrink the margin that keeps equipment cool during a failure.
Measure the boundary before you trust the PUE
PUE is a ratio: total facility electricity for each unit of electricity delivered to IT equipment.
PUE = total facility energy (kWh) / IT equipment energy (kWh)
Use the same period and the same units for both numbers. Annual PUE takes annual kWh. A power reading at one moment gives a different result.
The US Department of Energy’s Federal Energy Management Program (FEMP) uses the annual energy-based definition. The international standard, ISO/IEC 30134-2:2026, sets out the metric and its reporting framework.
What belongs in each measurement
IT equipment energy is the electricity used by servers, storage, networking, and other equipment inside the IT boundary.
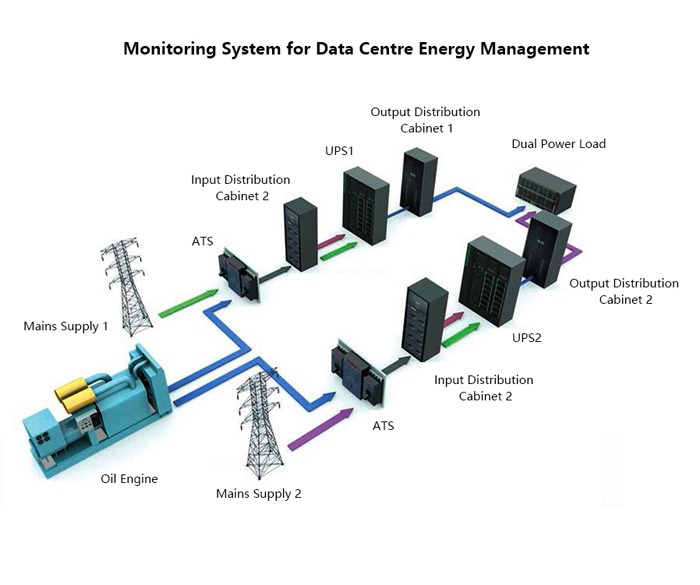
Facility energy is the electricity the data center as a whole uses. Subtract IT energy and what remains is overhead: cooling equipment, pumps, fans, electrical distribution and uninterruptible power supply (UPS) losses, lighting, and other auxiliaries. Before you change rack power, cooling systems, or network availability, review the data center infrastructure dependency map.
UPS conversion losses, distribution, and auxiliary systems keep drawing power even after cooling improves. The guide to data-center UPS systems covers capacity, battery runtime, and transfer switches, the electrical protection and redundancy decisions behind that overhead.
Take a hypothetical facility with these annual measurements:
- Total facility energy: 12,000 MWh.
- IT equipment energy: 8,000 MWh.
- Calculated overhead: 4,000 MWh.
- Annual PUE: 1.50.
Those 4,000 MWh are the combined overhead inside your boundary. To split out cooling’s share, you need readings from the cooling equipment.
The meter inventory
Before you calculate or compare PUE, list the incoming facility electricity meters, the IT feeders, any on-site generation, shared loads, and any equipment that no meter covers.
Mixed-use buildings need extra care. A building with offices and a server room cannot count all its consumption as data-center energy. The 2026 edition of ISO/IEC 30134-2 covers mixed-use sites, unaccounted energy, and on-site generation.
For each meter, record its location, purpose, assigned loads, reporting interval, and missing readings. Reconcile incoming facility energy against IT feeder totals and known supporting loads, and investigate unexplained gaps, unmetered equipment, and shared-load allocations. Log any unresolved energy before you treat the result as your operational baseline.
Why a better PUE can still mean more total electricity
PUE can improve because overhead shrinks as a share of the total while total electricity rises. The IT-energy denominator matters as much as the facility-energy numerator.
Take two hypothetical annual scenarios with the same measurement boundary:
| Measurement | Baseline A | Changed workload B | Change from A to B |
|---|---|---|---|
| Facility energy | 10,000 MWh | 12,000 MWh | +2,000 MWh |
| IT equipment energy | 6,000 MWh | 8,000 MWh | +2,000 MWh |
| Facility overhead | 4,000 MWh | 4,000 MWh | 0 MWh |
| PUE | 1.67 | 1.50 | −0.17, approximately |
In B, IT equipment receives 2,000 MWh more while overhead stays at 4,000 MWh. PUE drops from 1.67 to 1.50, yet the site uses 2,000 MWh more electricity: 12,000 MWh against 10,000.
Where the improvement came from
The facility might run more installed computing capacity, load existing equipment harder, or support a different amount of work. Each has different financial and operational consequences.
A higher IT load makes fixed or partly fixed overhead a smaller fraction of the total. Cooling and electrical conversion systems also change efficiency as demand changes.
Data Center Infrastructure Efficiency (DCiE) shows the same relationship from the other side:
DCiE = 1 / PUE (multiply by 100 to express as a percentage)
At a PUE of 1.50, DCiE is approximately 66.7%, the IT share of facility electricity. It says nothing about how much computing got done. That needs a separate measure of completed work.
Can an IT consolidation save electricity while making PUE worse?Yes. If consolidation cuts IT energy faster than overhead falls, the denominator shrinks and PUE rises, even though total electricity consumption drops. Read the result against absolute energy totals and a comparable workload record.
Benchmark PUE without comparing unlike facilities
A published PUE benchmark is useful once you know its population, weighting, and measurement method.
The Uptime Institute’s 2026 Global Data Center Survey reports an industry-wide annual-average PUE of 1.52. A capacity-weighted treatment produces 1.36, because weighting gives more influence to facilities with more capacity. Uptime’s 2025 survey reported a weighted-average annual PUE of 1.54. The gap between methods matters most when large installations operate differently from smaller buildings.
Why scale changes the comparison
A newer large data center can be designed around integrated air management, electrical distribution, mechanical equipment, and controls that an older installation could not easily adopt. A legacy facility may carry inherited room layouts, equipment constraints, or partial-load conditions, so measuring it against a new hyperscale campus tells you little.
One Reddit contributor voiced the skepticism:
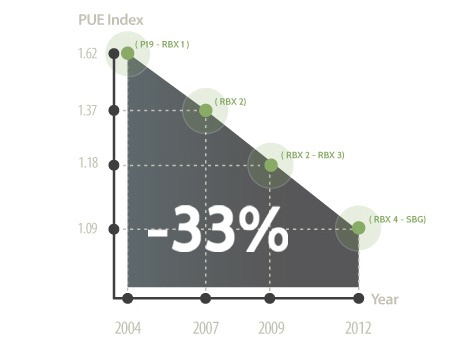
They say the most efficient hyperscale data centers are hitting a PUE of 1.09. Apparently for the rest of the market, 1.3-1.5 is considered pretty good. I can’t wrap my head around that. These massive facilities which have 1000x more possibilities of inefficiency are claiming they have significantly more efficiency. Can that really be true for all of their massive sites around the world? How does a 1.5GW facility keep such an amazing PUE over a 20MW site? Why don’t smaller data centers hit the same PUE?
The post gives no site measurements behind its numbers, but the question is a fair one.
Before you use an external number as a benchmark, classify the facility by age, scale, climate, loading, measurement interval, and averaging method. A different cooling design or seasonal operating pattern can legitimately produce a different result.
The US electricity context
Lawrence Berkeley National Laboratory’s United States Data Center Energy Usage Report: 2025 Update, published in June 2026, estimates 649 TWh of US data-center electricity consumption in its 2030 reference scenario. That is approximately 11.8% of projected US electricity consumption.
The report gives a compounded uncertainty range of 521 to 843 TWh, or approximately 9.5% to 15.3%. These are modeled outcomes built on assumptions about equipment deployment, consumption, cooling, facility classes, and locations.
The report’s official LBNL publication record gives the national context. Those figures describe aggregate demand, while your own decisions rest on your facility’s consumption and constraints.
For a facility-level benchmark, compare against a cohort with compatible reporting practices, then read operational changes against your own consistent time series. Uptime’s 2026 PUE analysis shows why the aggregation method matters.
Track water, carbon and completed work next to PUE
Facility electricity is one dimension of data-center performance. Water use, energy-related emissions, and completed computing work can move in different directions during the same project.
| Metric | Meaning or calculation | Main measurement question |
|---|---|---|
| PUE | Facility energy divided by IT equipment energy | How much facility electricity accompanies IT electricity? |
| Absolute facility energy | Total facility kWh or MWh for the period | How much electricity did the site use? |
| DCiE | 1/PUE, usually expressed as a percentage | What fraction of facility electricity is assigned to IT? |
| Water Usage Effectiveness (WUE) | Annual site water use in liters / annual IT electricity in kWh | How much site water is used per IT kWh? |
| Carbon Usage Effectiveness (CUE) | Annual data-center CO₂e emissions / annual IT equipment energy (kg CO₂e/kWh), with a declared accounting boundary | What emissions intensity is being reported, and under which boundary? |
| Useful work per unit of energy | Comparable completed work divided by the associated energy | How much useful work is obtained for the energy consumed? |
| Energy reuse indicators | Measures describing useful heat recovery or reuse | Does recovered heat create an additional benefit outside the raw PUE figure? |
The US Department of Energy’s cooling-water efficiency guidance explains the site-water measurement boundary. WUE is expressed in liters per kilowatt-hour. ISO/IEC 30134-9:2022 also addresses WUE, and a second-edition draft was under development during 2026.
Why the accounting boundaries matter
A cooling system that rejects heat by evaporation needs less mechanical electricity and draws more on-site water. A dry system saves direct evaporative water and changes the electricity needed for heat rejection. Local climate, water availability and quality, and equipment configuration set the balance.
Site WUE measures a specified water boundary. Electricity-generation water and wider supply-chain effects sit outside it.
The water source matters too. Reclaimed water can ease the burden on potable supplies even when the measured site volume stays similar.
Carbon indicators add another boundary. Electricity source, emissions scope, accounting method, and reporting period all affect interpretation, and a better facility-energy ratio can come with a different emissions outcome.
Useful computing work is harder to pin down. Completed transactions, processed jobs, and other workload outputs need consistent definitions before you can compare efficiency across equipment or applications.
When precise-looking numbers are estimates
A Reddit contributor who built a visualization of estimated data-center water use explained the uncertainty behind it:
Made this after getting curious how the water-use numbers thrown around in AI news articles actually stack up site-by-site. A few notes: What it shows: a running estimate of global AI/data-center water use, a map of 30 real campuses (Google, Amazon, Microsoft, Meta, Oracle, Apple, Alibaba) sized by estimated annual water draw, and a comparison chart against things like golf courses, fast fashion, and fossil fuel plants on a log scale. Data sources: per-site figures are triangulated from sustainability reports, utility/permit filings, and known cooling tech + climate where companies don’t disclose (most don’t). The global baseline is anchored to Lawrence Berkeley National Lab’s 2024 Data Center Energy Usage Report, linked in the site’s Methodology section. Tools: React + D3.js for the map, all client-side, no backend. Caveat I want to be upfront about: these are order-of-magnitude estimates, not audited numbers, happy to take corrections if anyone has better sourcing on specific sites!
Comparing facilities on measured water use requires site readings with a declared accounting boundary.
Keep a scorecard with four groups: electricity and PUE; site water and WUE; carbon scope and method; and useful workload output. Give each entry a unit, period, and boundary. Mark any indicator you have not measured as “not measured,” so a missing reading never looks like a zero.
Choose efficiency levers by IT load, climate and heat-rejection design
The right intervention depends on where your electricity goes and what the facility must keep doing reliably. A lightly loaded room with avoidable air recirculation poses a different problem from a high-density AI installation with concentrated rack heat, and the same intervention gives different electricity, water, and maintenance results at each.
Begin with the load and airflow
Idle or poorly utilized IT equipment draws electricity and adds heat that cooling equipment must remove. Consolidation and capacity right-sizing can cut both, as long as peak requirements, availability, and service obligations allow it.
On the cooling side, hot-aisle and cold-aisle containment stops supply and exhaust air from mixing. Blanking, airflow paths, and inlet-level monitoring show where cooling reaches equipment and where recirculation or bypass undermines it. With a poor airflow arrangement, a facility spends electricity moving and conditioning air that does little useful cooling.
Variable-frequency drives and building-management controls match fan and equipment operation to demand. Their value depends on the installed equipment, control sequences, minimum airflow requirements, and the thermal conditions you must hold.
Compare interventions through their consequences
| Candidate intervention | Potential energy mechanism | Important competing condition | Evidence needed for evaluation |
|---|---|---|---|
| IT consolidation | Reduce idle equipment energy and related heat | Peak demand and workload resilience | Energy per comparable completed workload |
| Airflow containment | Reduce bypass and recirculation | Layout errors and rack hotspots | Rack-inlet readings and cooling energy |
| Variable-speed controls | Match fan and plant output to demand | Control stability and operating limits | Equipment trends and site electricity |
| Higher permitted inlet temperatures | Expand suitable economizer operation | Equipment tolerance, humidity, and hotspots | Installed-equipment requirements and inlet readings |
| Air-side or water-side economizers | Reduce mechanical cooling under favorable conditions | Local weather, seasonal limits, and air or water quality | Suitable operating hours and energy trends |
| Evaporative heat rejection | Reduce mechanical cooling demand in applicable conditions | Water consumption, treatment, and maintenance | Site electricity, water volume, and WUE |
| Dry heat rejection | Reduce direct evaporative water demand | Climate-sensitive electrical load | Comparable site energy and water data |
| Direct-to-chip or liquid cooling | Capture concentrated heat close to equipment | Pumps, heat exchangers, rack compatibility, and ultimate heat rejection | Rack thermal performance and complete facility resource use |
Equipment selection is a separate engineering decision. See data-center cooling methods for air cooling, evaporative systems, and liquid loops.

Economizers, water, and the final heat-rejection path
An economizer uses suitable ambient conditions to cut reliance on mechanical cooling. Its operating hours depend on outdoor temperature, humidity, air quality, and system design.

Evaporative approaches use water in heat rejection: cooling-tower makeup water, evaporation, and blowdown set the site-water requirement. A dry alternative changes that relationship but can add mechanical electricity demand under some operating conditions.
The final heat-rejection arrangement matters most when a system is described as closed-loop.
A liquid circuit inside a rack or between equipment and a cooling distribution unit can stay closed while the heat ends up at a plant that uses evaporative cooling. The heat-collection loop and the outdoor heat-rejection method are separate parts of the system.
For coolant distribution units, liquid loops, and heat exchangers, see closed-loop liquid cooling components.
High-density AI changes the thermal problem
High-density AI installations can concentrate substantial heat in individual racks. Rear-door heat exchangers and direct-to-chip liquid systems are two ways to collect it.
ASHRAE’s AI data-center energy and thermal framework discusses high-density examples around 60 to 120 kW per rack and above. At that density, rack-level thermal conditions and compatible heat-removal paths need evaluation.
To shortlist an intervention, compare its expected effect on facility electricity and WUE against your IT load, inlet-temperature distribution, equipment limits, expected weather, economizer hours, cooling control mode, water source, and constraints. Then move the candidate into engineering review.
Protect reliability when a seemingly efficient change backfires
An energy-saving change fails its purpose when it compromises cooling or power resilience. UPS and cooling redundancy protect the facility during equipment faults, while poorly understood fan controls or temperature changes can trigger alarms, unexpected control responses, and greater thermal exposure.
Room-average temperatures can hide rack-inlet hotspots. Safe operating conditions depend on installed equipment, humidity, monitoring, contractual availability obligations, and failover behavior.
Before an authorized trial, have the operations team document inlet readings, active alarms, controller overrides, redundancy requirements, and rollback triggers under your established change-control process.
Prove an efficiency upgrade with a matched before-and-after record
An upgrade proves itself through comparable measurements taken before and after the intervention. A new PUE reading counts when the reporting boundary stays consistent and operating conditions explain what changed.
The baseline should describe energy use, IT load, and the conditions that drive cooling demand. The follow-up record names the intervention, commissioning period, altered equipment or controls, and any change in metering.
Weather and workload complicate the comparison. A cooler period lowers cooling demand even when the equipment arrangement has not changed, and a different computing load changes the PUE denominator.
Build a comparison that can be signed off
| Record | Baseline information | After-intervention information |
|---|---|---|
| Measurement boundary and dates | Meters, included loads, reporting interval | Same scope or documented change |
| Facility and IT electricity | Both energy totals in kWh or MWh | Both totals for the comparison period |
| Overhead and PUE | Facility minus IT energy; calculated PUE | Recalculated values and absolute differences |
| Water use and WUE | Site water volume and IT-energy denominator, where material | Matched water measurement and WUE |
| Workload and weather | Completed work, IT utilization, ambient conditions | Comparable operating conditions or documented differences |
| Reliability | Thermal readings, alarms, failures, and service interruptions | Same indicators after the change |
| Intervention record | Existing equipment and controls | Modified configuration and commissioning period |
Treat the periods as comparable when meter boundaries and the workload and weather conditions are sufficiently alike. If conditions changed materially, document the difference and any supported adjustment. If the record cannot isolate the intervention’s effect, classify the outcome as inconclusive.
One evaluation criterion is lower total facility energy for a comparable IT workload, with thermal performance and service reliability preserved. Where water is material, include the change in site-water consumption and WUE.
Three possible outcomes
- Validated: Comparable measurements support the expected improvement, with no deterioration in the reliability guardrails.
- Inconclusive: Metering, workload, weather, or reporting differences prevent a defensible attribution of the result.
- Adverse: The change produces an unacceptable energy, water, thermal, or availability outcome under the site’s operating requirements.
Take a hypothetical facility that holds annual IT energy at 8,000 MWh while reducing annual facility energy from 12,000 to 11,600 MWh. PUE changes from 1.50 to 1.45, and absolute facility energy falls by 400 MWh. Those figures show what the two measurements say. Showing that a particular upgrade caused the difference requires a compatible workload, boundary, and operating comparison.