
For developers, operators, and technical stakeholders, choose the simplest cloud architecture view that makes the system’s boundaries and flows understandable and checkable. Skip the one with the most service icons. If one drawing must serve both business context and deployment or security review, split it into two linked views; then trace a request and verify the depicted resources against the intended or live environment.
What a Cloud Architecture Diagram Shows
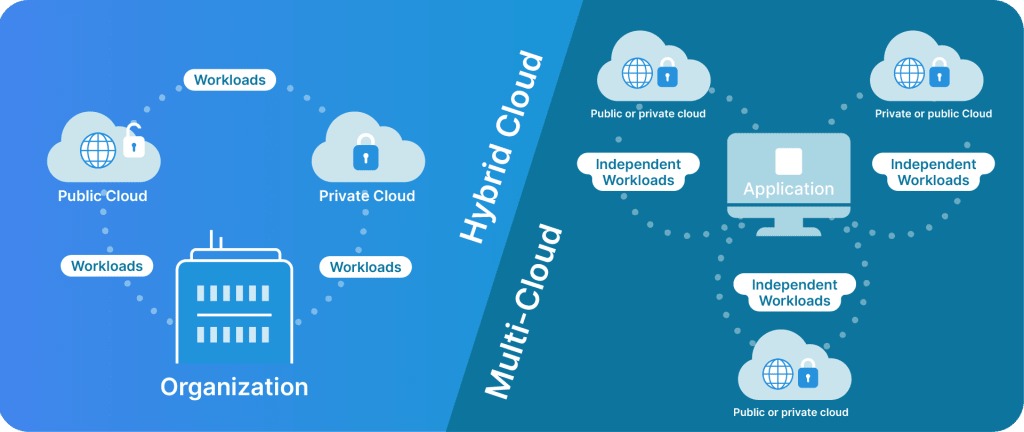
A cloud architecture diagram is a visual model of the components, boundaries, and relationships in a cloud-hosted system. Label every one as a conceptual design, a proposed deployment, or an observed deployment. Without that label, readers can’t tell whether they’re looking at a plan or a running system. A diagram shows intent. It tells you nothing about security, availability, compliance, performance, cost, or what is configured in the cloud account.
Choose the Right View: Context, Service, Deployment, or Data Flow
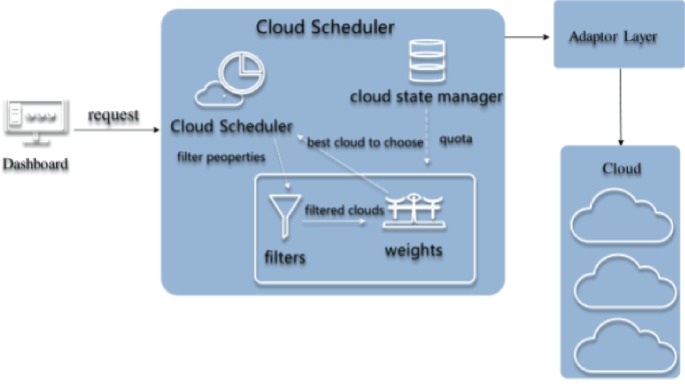
Start with the question the diagram must answer. A project manager asking about an application’s external dependencies needs a different view from an engineer investigating subnet connectivity, even when both look at the same system.
Microsoft’s architecture diagramming guidance organizes diagrams around purpose, audience, and place in the system lifecycle. One cloud application can be drawn at several levels of detail, and each level is legitimate.
| Question the reader needs answered | Diagram view | Show | Leave out of this view |
|---|---|---|---|
| Who uses the system, and what does it interact with? | System context | Users, system boundary, external dependencies | Individual instances, subnets, routes |
| Which applications and data stores perform the work? | Logical or service view | Major application units, data stores, responsibilities | Full infrastructure placement |
| Where do resources run, and how are they connected? | Deployment or network view | Region, VPC, AZs, subnets, compute, network entry points | Detailed business process sequences |
| What happens during a particular operation? | Data-flow or dynamic view | Interaction order, senders, receivers, exchanged information | Unrelated infrastructure inventory |
Take a fictional information website. The context view shows a visitor, the application, and an external integration. The deployment view places the application and its data tier inside cloud networking boundaries. Same application, different questions.
The C4 model defines four zoom levels: system context, container, component, and code. It also describes supporting dynamic and deployment diagrams. In C4, a container is a deployable or runnable application or data-store unit. A web application or a database counts as one, whether or not it uses Docker or Kubernetes.
Use the levels that answer your reader’s questions. Context and container views may be enough for an application overview. A network review needs deployment detail that the context diagram deliberately leaves out.
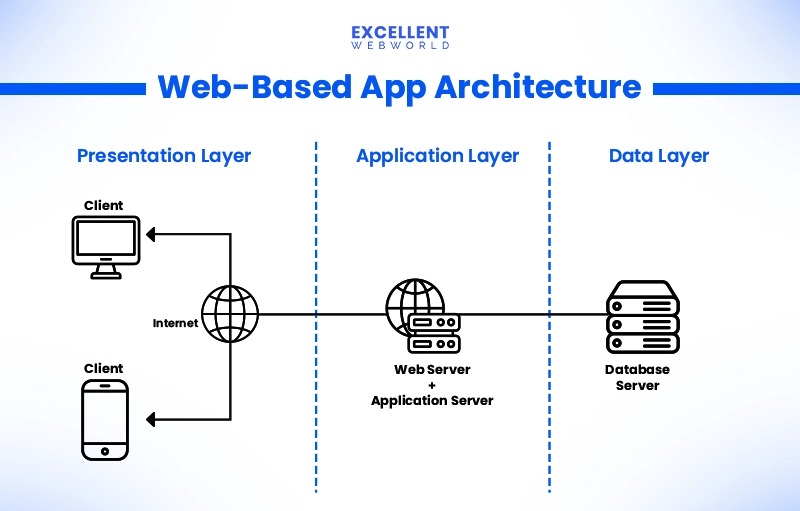
A developer on r/softwarearchitecture describes the problem:
I can code well and can create a decent architecture of a project but fails to represent the logic and architecture in a visual format. I tried looking at different UML diagrams but i still go to a flowchart mode by default when I start drawing a new diagram. I have seen people using different types of components and make diagrams look visually appealing, but when i start drawing, i can only think of choosing some rectangles, and connect them using arrows and maybe a few conditional blocks. How can i get better?
Rectangles and arrows are fine. What matters is that you explain what each rectangle contains and what each arrow means.
Before choosing a template, write down five things: the audience, the question, whether the system is planned or running, the detail needed, and the view. If the brief mixes a business-context question with a network-security question, plan two linked views that share the same assumptions.
Read Symbols, Boundaries, and Arrows Without Guessing
An icon identifies a component, a surrounding shape sets its boundary, and a labeled connector describes a relationship. A database icon says storage exists. The box around it says where it sits. The arrows say which operations the drawing covers.
Understand the AWS boundaries
The placement rules for an AWS deployment example come from the AWS VPC and subnet documentation.
An AWS VPC belongs to one Region and can include subnets across multiple Availability Zones. Each subnet belongs to one AZ. A drawing that spans two AZs shows a regional VPC with subnets in both zones.
Place the Region around the whole workload, draw the VPC boundary inside it, and show separate AZ groups with their subnets inside the VPC. That layout avoids implying that the VPC belongs to a single AZ.
Label a network boundary and a trust boundary separately when they differ. A private-subnet label tells you where a resource sits. Access depends on routing, security policies, and service configuration.
Give each arrow a specific meaning
For a web application, three relationships cover most cases:
- Request:
Browser → public entry, labeled as an HTTPS request. - Application data:
Application → data store, labeled as a query or data operation. - External call:
Application → external API, labeled as outbound application traffic.
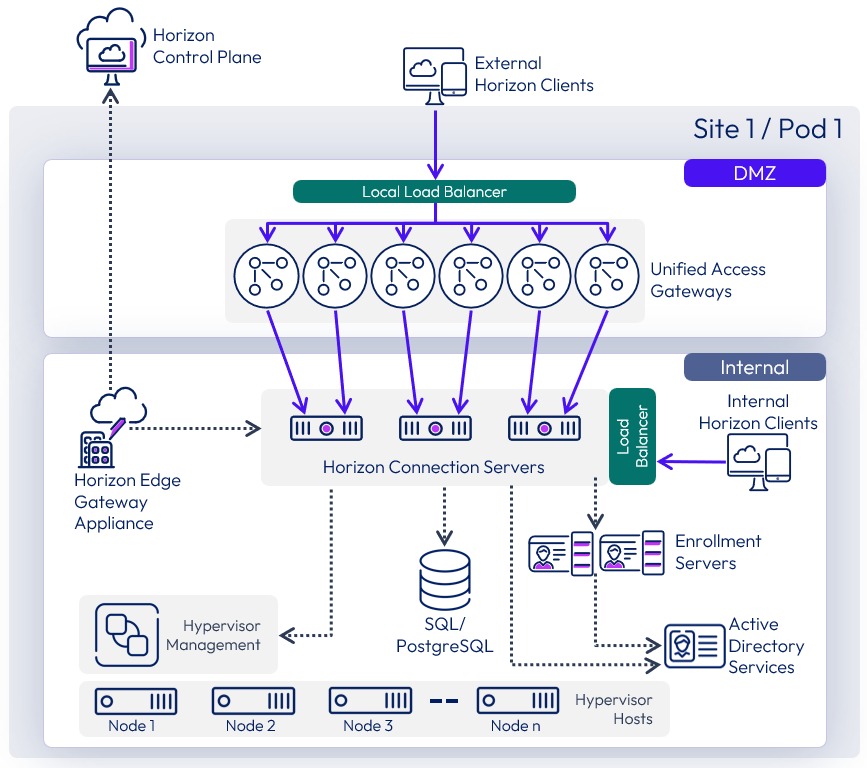
Use different line styles for responses, asynchronous events, and dependencies, and explain each in a small legend. Arrows show direction. Color helps people scan a diagram, but the meaning must survive without it.
DNS resolution and an HTTPS request are separate interactions. The browser needs an address for the host. If it has no usable cached answer, it resolves the name through DNS, then sends the HTTPS request along the network path.
Some managed and edge services sit outside the application’s VPC. Draw them where they actually live. Putting an edge or global service inside a private subnet because it fits the layout misrepresents the model.
To test the notation, pick three arrows and write one sentence for each, naming the sender, receiver, and relationship. If you can’t, the line needs a better label, a legend entry, or a different diagram view.
Cloud Architecture Diagram Example: A Three-Tier Web Application
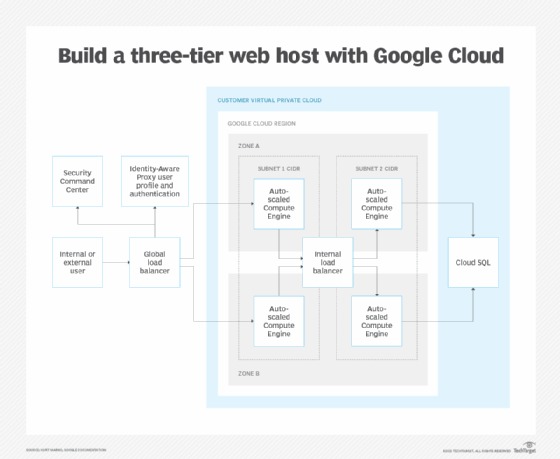
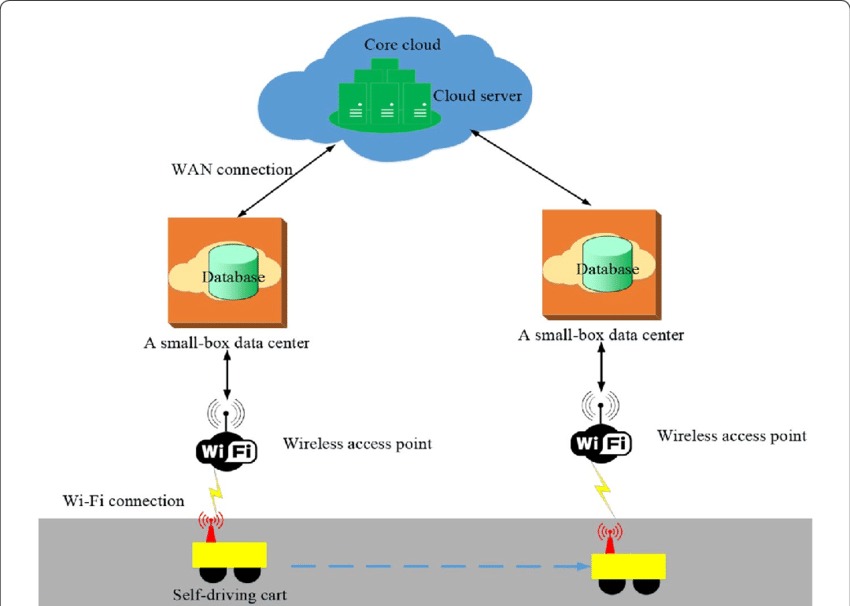
Take a hypothetical online information service with a browser interface, an application layer, and a data store. The diagram follows one request and the cloud boundaries it crosses.
This AWS-inspired example is a proposed design: one Region, one VPC, and application placements in two Availability Zones. Service configuration and deployed state are unspecified.
The components and their roles
The browser sits outside the application’s cloud deployment. A public entry point receives web requests, application compute handles them, and a logical data tier stores and returns the information.
Two application placements, AZ A and AZ B, show one way to distribute the application. Each sits in its own subnet in the same regional VPC. How the data tier is deployed and replicated is left out.
| Component | Depicted boundary | Responsibility | Labeled relationship | To verify |
|---|---|---|---|---|
| User browser | Outside application VPC | Initiates requests and receives responses | HTTPS request and response | Destination |
| DNS service | Separate from application request path | Resolves the application name | DNS lookup | Name resolution setup |
| Public entry | Workload entry boundary | Receives incoming application traffic | Forward request to application | Resource and routing |
| Application compute A | Private app subnet, AZ A | Processes application requests | Application request and data access | Deployed resource |
| Application compute B | Private app subnet, AZ B | Second application placement | Application request and data access | Distribution and health behavior |
| Logical data tier | Private logical data boundary | Handles application data operations | Data query and result | AZ placement, access, replication |
A load-balancing service can serve as the public entry. The application tier can run on instances, containers, or managed compute; the example doesn’t choose.
Follow one request
A visitor opens an article on the information website. Once the browser has the host address, the request passes through the public entry, the application tier, and the logical data tier. Each step has a label:
- Inbound request: Browser → public entry, HTTPS request for the article.
- Application hop: Public entry → application compute A or B, forwarded request.
- Data exchange: Application compute → logical data tier, query; logical data tier → application compute, result.
- Return path: Application compute → public entry → browser, application response.
What the example leaves open
Two Availability Zones on a diagram don’t make a system highly available. Instance behavior, shared dependencies, data replication, health checks, and failover decide whether the service survives a failure.
For a real environment, trace an inbound request and its response from the browser to the application and data tier. Name the receiving component at every hop and mark where the diagram stops explaining where traffic or data goes.
How to Draw a Cloud Architecture Diagram in Six Passes
Build the drawing around one reader question and a minimal path. The sequence below keeps placement, behavior, and presentation decisions separate, so the first sketch stays uncluttered.
- Set the purpose. Use the audience and view you already chose. State the operation or relationship the finished drawing must explain.
- Place the boundaries. Draw users and external systems, then the cloud workload boundary. Add Region, VPC, AZ, and subnet groups when the view needs deployment detail.
- Add the working components. In the example, that means the public entry, application compute, and data tier. Give each a responsibility before adding optional services.
- Connect the interactions. Draw directional request, response, and data relationships, with labels that name the operation. Add outbound calls or asynchronous events only where the workflow needs them.
- Make it readable. Add a compact legend, a meaningful title, the intended audience, and the represented state. Keep provider icons consistent and make sure labels read without color.
- Test the explanation. Give the first version to someone who didn’t draw it. Ask them to describe each component’s responsibility and point out relationships they can’t interpret. Revise those areas.
Check the Diagram for Hidden Network and Failure Assumptions
The boundaries and paths in a diagram raise specific questions about access, connectivity, and failure behavior. For the example web application, review five areas and give each one outcome: visible, documented elsewhere, or unverified.
| Review area | Question raised by the drawing | Evidence to examine |
|---|---|---|
| Exposure | Which resources can receive traffic from outside the workload? | Public entry, actual resource placement, security and network configuration |
| Egress | How does a private application resource reach an external service? | Routes, gateways, endpoints, and connection configuration |
| Trust | Which components may access data or cross a trust boundary? | Identity/access rules, network controls, service permissions |
| Failure | What happens when an instance, AZ, or shared dependency is unavailable? | Resource placement, health behavior, dependencies, and failover configuration |
| Recovery | How are problems detected and data or service restored? | Monitoring, health checks, backups, and recovery documentation |
For AWS infrastructure, route tables, gateways, security groups, and network ACLs determine connectivity and access. Find the controls that govern each depicted path and compare their configuration with the diagram. Before changing subnet routes, security groups, or NAT gateways, review the AWS VPC routing and subnet guide for the implications.
The two-AZ example is a good test of failure assumptions. If AZ A goes down, which application components remain? Does the public entry send traffic to an available resource? What happens to the data tier and any shared dependency?
If you have access to the environment, inspect the VPC resources, application configuration, and operational records. Carry unresolved questions into the implementation review.
Show the Same System Clearly to Engineers and Stakeholders
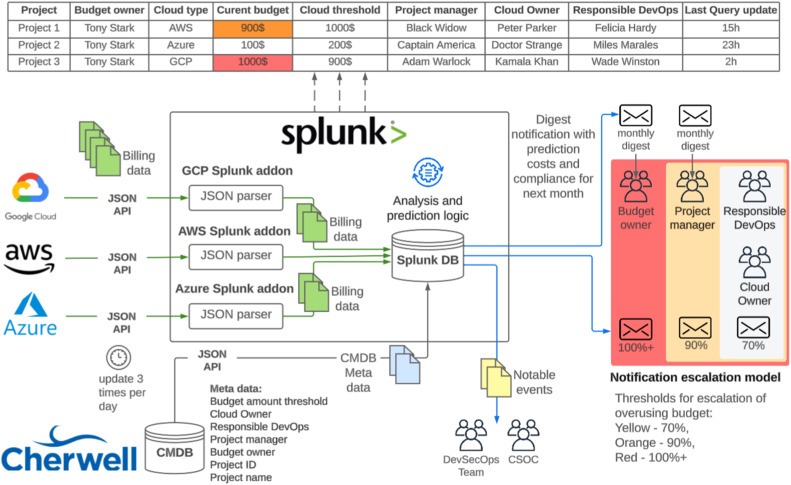
A stakeholder diagram needs fewer technical details but keeps the dependencies that matter to the decision. For the information website, the two views describe the same workload with different names and boundaries:
- Stakeholder view: Visitor → information website → stored content. If the design includes an external integration, name it by its business purpose and show the connection.
- Engineering view: Browser → public entry → application compute A/B → logical data tier, with the Region, VPC, two AZs, and app subnets drawn around the components. Entry and data-tier implementation details are left out.
Both views should agree on the application’s user-facing role, stored information, and external dependencies. The engineering version adds placement and flow detail.
A developer on r/softwarearchitecture describes the gap between the two audiences:
My internal dev diagrams (Mermaid, quick sketches, or raw code) are great for me, but when I show them to a client or a PM, it’s hard for them to understand and i always need to play role of subtitle. On the flip side, if I move over to a “design” tool like Figma or a heavy enterprise tool like Visio to make it look professional/board-ready, I end up wasting 2+ hours just aligning boxes and arrows. It feels like there’s a massive gap between “functional for devs” and “clear for stakeholders.” I’m looking for a way to turn a technical brain-dump into something polished enough for a slide deck , a LinkedIn post or slide presentation without the manual “pixel-pushing” overhead.
The failure to avoid is a diagram that only works with a live narrator.
Name the role first and the provider product second when both matter. “Application service” tells a reader the function immediately. The cloud resource name can follow in smaller text or in an engineering companion view.
Choose a Diagram Workflow and Keep It in Sync
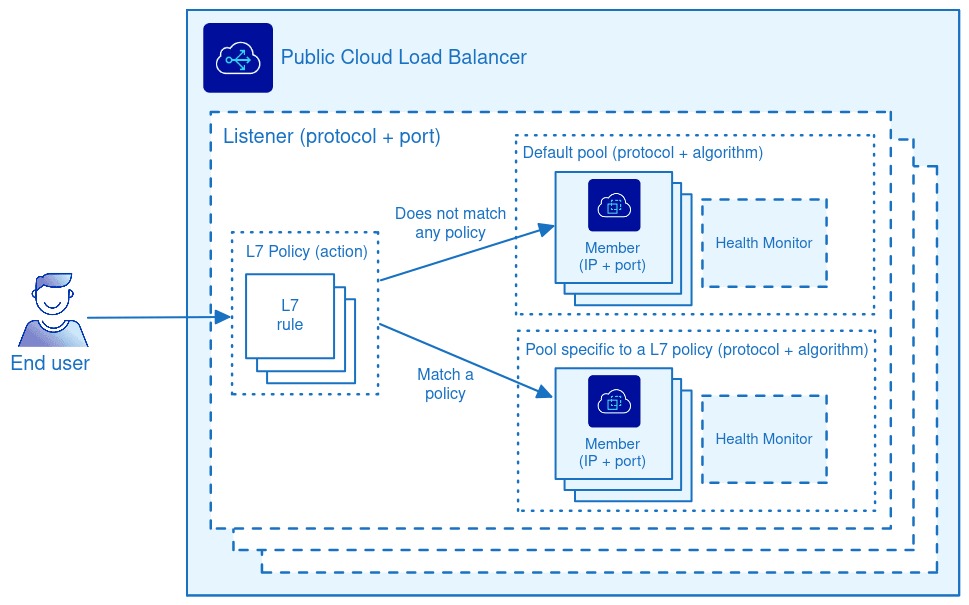
The right workflow depends on who edits the architecture model and what the diagram must represent. A manual drawing tool, a diagram-as-code workflow, and a cloud inventory view each solve a different maintenance problem.
| Approach | Well suited to | Source of truth | Ongoing work | Main blind spot |
|---|---|---|---|---|
| Manual visual editor | Explaining a design to a particular audience | Editable drawing plus human-maintained system knowledge | Update components, connections, labels | Diagram can drift after implementation changes |
| Diagram as code | Versionable, reproducible representations | Textual model or diagram definition | Keep declarations aligned with architecture changes | Missing or incorrect semantics |
| Cloud inventory-derived view | Inspecting resources and some infrastructure relationships | Provider resource inventory | Interpret the captured scope and validate freshness | Application intent and business flows may be absent |
A new external API, an altered subnet, or a replaced application service can change what the diagram means. The workflow you choose determines how those changes reach the editable source and the people who rely on it.
One account from r/softwarearchitecture describes what happens when documentation drops out of the team’s routine:
At my current team, we started out with decent arch docs “how the system works” pages. Then we shipped for a few weeks, priorities changed, a couple of us made small exceptions and now suddenly we don’t use the them anymore and they r lost in time. If you’ve found a way to keep this from rotting, what’s the trick? like ADRs that people would actually read ? some sort of PR gate and checklist? or do you just accept it and rely on code review + tribal knowledge? Would love to hear what’s worked ! (or what you tried that was a total waste of time) EDIT: Thanks everyone for your advice !!
A minimal maintenance record
Store a small maintenance record with the diagram or its editable source:
- Owner: The person or team responsible for reviewing architectural changes.
- Represented state: Conceptual, as-designed, or as-deployed, with the intended scope.
- Last reviewed: The actual date the model was checked.
- Editable source: The source file or version-controlled location.
- Validation source: The resource inventory or documentation used to support the claims.
- Change trigger: A new service, changed boundary, new integration, altered traffic relationship, or significant architecture decision.
A stable system-context diagram stays useful through implementation changes that leave its relationships intact. Detailed deployment diagrams need review whenever changes affect the resources, boundaries, or interactions they show.
Apply this record before you circulate a diagram as an observed representation of the running system. If you have access to the resources, compare the deployment view with the cloud inventory and document any difference that affects its use.
Before changing identity boundaries, recovery objectives, or network routes, review the cloud architecture workload assessment for the implications.